
Advertisement
Grace Fabric TechnologyLtd (SHSE:603256) Is Making Moderate Use Of Debt
David Iben put it well when he said, 'Volatility is not a risk we care about. What we care about is avoiding the permanent loss of capital.' When we think about how risky a company is, we always like to look at its use of debt, since debt overload can lead to ruin. We can see that Grace Fabric Technology Co.,Ltd. (SHSE:603256) does use debt in its business. But should shareholders be worried about its use of debt?
What Risk Does Debt Bring?
Generally speaking, debt only becomes a real problem when a company can't easily pay it off, either by raising capital or with its own cash flow. If things get really bad, the lenders can take control of the business. While that is not too common, we often do see indebted companies permanently diluting shareholders because lenders force them to raise capital at a distressed price. By replacing dilution, though, debt can be an extremely good tool for businesses that need capital to invest in growth at high rates of return. The first thing to do when considering how much debt a business uses is to look at its cash and debt together.
View our latest analysis for Grace Fabric TechnologyLtd
How Much Debt Does Grace Fabric TechnologyLtd Carry?
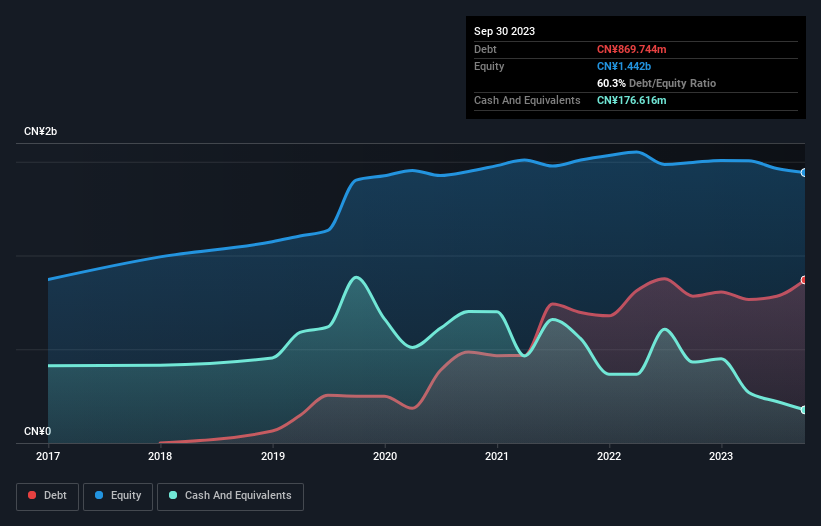
The image below, which you can click on for greater detail, shows that at September 2023 Grace Fabric TechnologyLtd had debt of CN¥869.7m, up from CN¥783.1m in one year. However, it also had CN¥176.6m in cash, and so its net debt is CN¥693.1m.
How Strong Is Grace Fabric TechnologyLtd's Balance Sheet?
The latest balance sheet data shows that Grace Fabric TechnologyLtd had liabilities of CN¥856.3m due within a year, and liabilities of CN¥263.1m falling due after that. Offsetting these obligations, it had cash of CN¥176.6m as well as receivables valued at CN¥357.3m due within 12 months. So its liabilities outweigh the sum of its cash and (near-term) receivables by CN¥585.5m.
Since publicly traded Grace Fabric TechnologyLtd shares are worth a total of CN¥6.05b, it seems unlikely that this level of liabilities would be a major threat. However, we do think it is worth keeping an eye on its balance sheet strength, as it may change over time. The balance sheet is clearly the area to focus on when you are analysing debt. But it is future earnings, more than anything, that will determine Grace Fabric TechnologyLtd's ability to maintain a healthy balance sheet going forward. So if you're focused on the future you can check out this free report showing analyst profit forecasts.
Over 12 months, Grace Fabric TechnologyLtd made a loss at the EBIT level, and saw its revenue drop to CN¥649m, which is a fall of 2.3%. We would much prefer see growth.
Caveat Emptor
Over the last twelve months Grace Fabric TechnologyLtd produced an earnings before interest and tax (EBIT) loss. Indeed, it lost CN¥66m at the EBIT level. When we look at that and recall the liabilities on its balance sheet, relative to cash, it seems unwise to us for the company to have any debt. Quite frankly we think the balance sheet is far from match-fit, although it could be improved with time. However, it doesn't help that it burned through CN¥340m of cash over the last year. So suffice it to say we consider the stock very risky. The balance sheet is clearly the area to focus on when you are analysing debt. But ultimately, every company can contain risks that exist outside of the balance sheet. For example, we've discovered 1 warning sign for Grace Fabric TechnologyLtd that you should be aware of before investing here.
If, after all that, you're more interested in a fast growing company with a rock-solid balance sheet, then check out our list of net cash growth stocks without delay.
New: Manage All Your Stock Portfolios in One Place
We've created the ultimate portfolio companion for stock investors, and it's free.
• Connect an unlimited number of Portfolios and see your total in one currency
• Be alerted to new Warning Signs or Risks via email or mobile
• Track the Fair Value of your stocks
Have feedback on this article? Concerned about the content? Get in touch with us directly. Alternatively, email editorial-team (at) simplywallst.com.
This article by Simply Wall St is general in nature. We provide commentary based on historical data and analyst forecasts only using an unbiased methodology and our articles are not intended to be financial advice. It does not constitute a recommendation to buy or sell any stock, and does not take account of your objectives, or your financial situation. We aim to bring you long-term focused analysis driven by fundamental data. Note that our analysis may not factor in the latest price-sensitive company announcements or qualitative material. Simply Wall St has no position in any stocks mentioned.
About SHSE:603256
Grace Fabric TechnologyLtd
Engages in the research and development, production, and sale of e-glass fabrics worldwide.
Adequate balance sheet with moderate growth potential.
Market Insights

Advertisement
Community Narratives
MicroVision will explode future revenue by 380.37% with a vision towards success
Fair Value US$60.00|98.5% undervalued
TH
Community Contributor
The Indispensable Artery for a New North American Economy
Fair Value CA$132.87|2.3% undervalued
TI
Community Contributor