
Advertisement
Grace Fabric Technology Co.,Ltd.'s (SHSE:603256) Popularity With Investors Is Clear
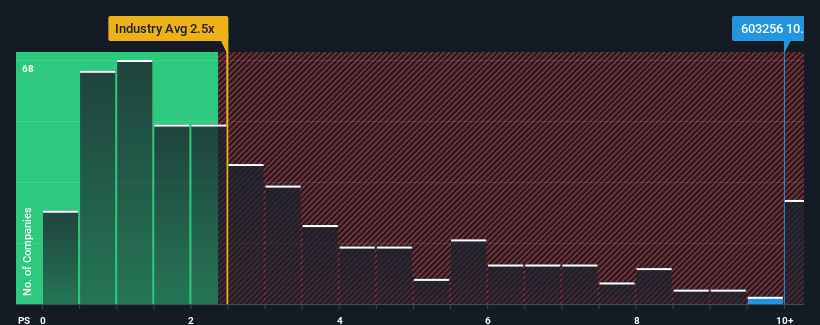
When you see that almost half of the companies in the Chemicals industry in China have price-to-sales ratios (or "P/S") below 2.5x, Grace Fabric Technology Co.,Ltd. (SHSE:603256) looks to be giving off strong sell signals with its 10x P/S ratio. Although, it's not wise to just take the P/S at face value as there may be an explanation why it's so lofty.
View our latest analysis for Grace Fabric TechnologyLtd
What Does Grace Fabric TechnologyLtd's Recent Performance Look Like?
With revenue growth that's superior to most other companies of late, Grace Fabric TechnologyLtd has been doing relatively well. It seems the market expects this form will continue into the future, hence the elevated P/S ratio. If not, then existing shareholders might be a little nervous about the viability of the share price.
Want the full picture on analyst estimates for the company? Then our free report on Grace Fabric TechnologyLtd will help you uncover what's on the horizon.Do Revenue Forecasts Match The High P/S Ratio?
There's an inherent assumption that a company should far outperform the industry for P/S ratios like Grace Fabric TechnologyLtd's to be considered reasonable.
Retrospectively, the last year delivered an exceptional 21% gain to the company's top line. However, the latest three year period hasn't been as great in aggregate as it didn't manage to provide any growth at all. So it appears to us that the company has had a mixed result in terms of growing revenue over that time.
Shifting to the future, estimates from the sole analyst covering the company suggest revenue should grow by 30% over the next year. Meanwhile, the rest of the industry is forecast to only expand by 25%, which is noticeably less attractive.
With this information, we can see why Grace Fabric TechnologyLtd is trading at such a high P/S compared to the industry. It seems most investors are expecting this strong future growth and are willing to pay more for the stock.
The Key Takeaway
Using the price-to-sales ratio alone to determine if you should sell your stock isn't sensible, however it can be a practical guide to the company's future prospects.
As we suspected, our examination of Grace Fabric TechnologyLtd's analyst forecasts revealed that its superior revenue outlook is contributing to its high P/S. It appears that shareholders are confident in the company's future revenues, which is propping up the P/S. It's hard to see the share price falling strongly in the near future under these circumstances.
It's always necessary to consider the ever-present spectre of investment risk. We've identified 1 warning sign with Grace Fabric TechnologyLtd, and understanding should be part of your investment process.
If you're unsure about the strength of Grace Fabric TechnologyLtd's business, why not explore our interactive list of stocks with solid business fundamentals for some other companies you may have missed.
New: Manage All Your Stock Portfolios in One Place
We've created the ultimate portfolio companion for stock investors, and it's free.
• Connect an unlimited number of Portfolios and see your total in one currency
• Be alerted to new Warning Signs or Risks via email or mobile
• Track the Fair Value of your stocks
Have feedback on this article? Concerned about the content? Get in touch with us directly. Alternatively, email editorial-team (at) simplywallst.com.
This article by Simply Wall St is general in nature. We provide commentary based on historical data and analyst forecasts only using an unbiased methodology and our articles are not intended to be financial advice. It does not constitute a recommendation to buy or sell any stock, and does not take account of your objectives, or your financial situation. We aim to bring you long-term focused analysis driven by fundamental data. Note that our analysis may not factor in the latest price-sensitive company announcements or qualitative material. Simply Wall St has no position in any stocks mentioned.
About SHSE:603256
Grace Fabric TechnologyLtd
Engages in the research and development, production, and sale of e-glass fabrics worldwide.
Adequate balance sheet with moderate growth potential.
Market Insights

Advertisement
Community Narratives
MicroVision will explode future revenue by 380.37% with a vision towards success
Fair Value US$60.00|98.4% undervalued
TH
Community Contributor
The Indispensable Artery for a New North American Economy
Fair Value CA$132.87|1.3% undervalued
TI
Community Contributor