
Advertisement
Grace Fabric Technology Co.,Ltd. (SHSE:603256) Stock Rockets 34% As Investors Are Less Pessimistic Than Expected
Grace Fabric Technology Co.,Ltd. (SHSE:603256) shareholders would be excited to see that the share price has had a great month, posting a 34% gain and recovering from prior weakness. Notwithstanding the latest gain, the annual share price return of 3.7% isn't as impressive.
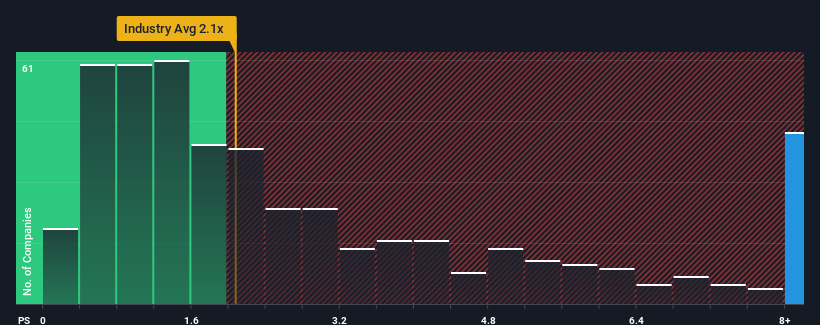
Following the firm bounce in price, you could be forgiven for thinking Grace Fabric TechnologyLtd is a stock to steer clear of with a price-to-sales ratios (or "P/S") of 11.4x, considering almost half the companies in China's Chemicals industry have P/S ratios below 2.1x. However, the P/S might be quite high for a reason and it requires further investigation to determine if it's justified.
See our latest analysis for Grace Fabric TechnologyLtd
How Grace Fabric TechnologyLtd Has Been Performing
While the industry has experienced revenue growth lately, Grace Fabric TechnologyLtd's revenue has gone into reverse gear, which is not great. It might be that many expect the dour revenue performance to recover substantially, which has kept the P/S from collapsing. However, if this isn't the case, investors might get caught out paying too much for the stock.
If you'd like to see what analysts are forecasting going forward, you should check out our free report on Grace Fabric TechnologyLtd.Is There Enough Revenue Growth Forecasted For Grace Fabric TechnologyLtd?
In order to justify its P/S ratio, Grace Fabric TechnologyLtd would need to produce outstanding growth that's well in excess of the industry.
Retrospectively, the last year delivered a frustrating 2.3% decrease to the company's top line. Unfortunately, that's brought it right back to where it started three years ago with revenue growth being virtually non-existent overall during that time. Accordingly, shareholders probably wouldn't have been overly satisfied with the unstable medium-term growth rates.
Turning to the outlook, the next year should generate growth of 20% as estimated by the sole analyst watching the company. With the industry predicted to deliver 24% growth, the company is positioned for a weaker revenue result.
With this in consideration, we believe it doesn't make sense that Grace Fabric TechnologyLtd's P/S is outpacing its industry peers. It seems most investors are hoping for a turnaround in the company's business prospects, but the analyst cohort is not so confident this will happen. There's a good chance these shareholders are setting themselves up for future disappointment if the P/S falls to levels more in line with the growth outlook.
What We Can Learn From Grace Fabric TechnologyLtd's P/S?
Shares in Grace Fabric TechnologyLtd have seen a strong upwards swing lately, which has really helped boost its P/S figure. Generally, our preference is to limit the use of the price-to-sales ratio to establishing what the market thinks about the overall health of a company.
Despite analysts forecasting some poorer-than-industry revenue growth figures for Grace Fabric TechnologyLtd, this doesn't appear to be impacting the P/S in the slightest. Right now we aren't comfortable with the high P/S as the predicted future revenues aren't likely to support such positive sentiment for long. This places shareholders' investments at significant risk and potential investors in danger of paying an excessive premium.
You need to take note of risks, for example - Grace Fabric TechnologyLtd has 2 warning signs (and 1 which is significant) we think you should know about.
If you're unsure about the strength of Grace Fabric TechnologyLtd's business, why not explore our interactive list of stocks with solid business fundamentals for some other companies you may have missed.
New: Manage All Your Stock Portfolios in One Place
We've created the ultimate portfolio companion for stock investors, and it's free.
• Connect an unlimited number of Portfolios and see your total in one currency
• Be alerted to new Warning Signs or Risks via email or mobile
• Track the Fair Value of your stocks
Have feedback on this article? Concerned about the content? Get in touch with us directly. Alternatively, email editorial-team (at) simplywallst.com.
This article by Simply Wall St is general in nature. We provide commentary based on historical data and analyst forecasts only using an unbiased methodology and our articles are not intended to be financial advice. It does not constitute a recommendation to buy or sell any stock, and does not take account of your objectives, or your financial situation. We aim to bring you long-term focused analysis driven by fundamental data. Note that our analysis may not factor in the latest price-sensitive company announcements or qualitative material. Simply Wall St has no position in any stocks mentioned.
About SHSE:603256
Grace Fabric TechnologyLtd
Engages in the research and development, production, and sale of e-glass fabrics worldwide.
Adequate balance sheet with moderate growth potential.
Market Insights

Advertisement
Community Narratives
MicroVision will explode future revenue by 380.37% with a vision towards success
Fair Value US$60.00|98.4% undervalued
TH
Community Contributor
The Indispensable Artery for a New North American Economy
Fair Value CA$132.87|1.3% undervalued
TI
Community Contributor