
Advertisement
Improved Revenues Required Before Shan Dong Lu Bei Chemical Co.,Ltd (SHSE:600727) Stock's 36% Jump Looks Justified
The Shan Dong Lu Bei Chemical Co.,Ltd (SHSE:600727) share price has done very well over the last month, posting an excellent gain of 36%. Looking back a bit further, it's encouraging to see the stock is up 30% in the last year.
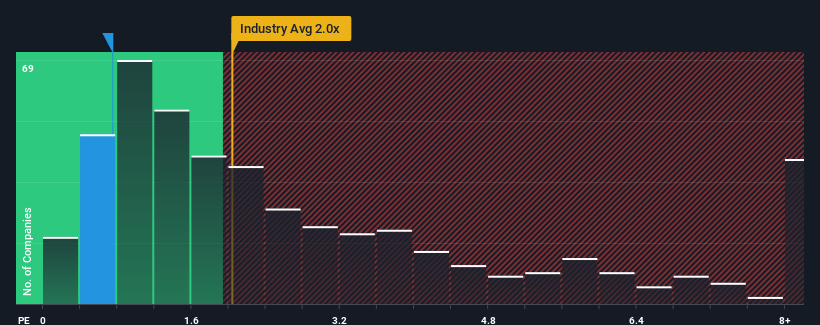
Even after such a large jump in price, Shan Dong Lu Bei ChemicalLtd may still be sending buy signals at present with its price-to-sales (or "P/S") ratio of 0.7x, considering almost half of all companies in the Chemicals industry in China have P/S ratios greater than 2x and even P/S higher than 5x aren't out of the ordinary. However, the P/S might be low for a reason and it requires further investigation to determine if it's justified.
View our latest analysis for Shan Dong Lu Bei ChemicalLtd
What Does Shan Dong Lu Bei ChemicalLtd's P/S Mean For Shareholders?
The revenue growth achieved at Shan Dong Lu Bei ChemicalLtd over the last year would be more than acceptable for most companies. It might be that many expect the respectable revenue performance to degrade substantially, which has repressed the P/S. If that doesn't eventuate, then existing shareholders have reason to be optimistic about the future direction of the share price.
Want the full picture on earnings, revenue and cash flow for the company? Then our free report on Shan Dong Lu Bei ChemicalLtd will help you shine a light on its historical performance.Do Revenue Forecasts Match The Low P/S Ratio?
Shan Dong Lu Bei ChemicalLtd's P/S ratio would be typical for a company that's only expected to deliver limited growth, and importantly, perform worse than the industry.
Retrospectively, the last year delivered an exceptional 17% gain to the company's top line. The latest three year period has also seen an excellent 70% overall rise in revenue, aided by its short-term performance. Therefore, it's fair to say the revenue growth recently has been superb for the company.
Comparing that to the industry, which is predicted to deliver 23% growth in the next 12 months, the company's momentum is weaker, based on recent medium-term annualised revenue results.
In light of this, it's understandable that Shan Dong Lu Bei ChemicalLtd's P/S sits below the majority of other companies. Apparently many shareholders weren't comfortable holding on to something they believe will continue to trail the wider industry.
What Does Shan Dong Lu Bei ChemicalLtd's P/S Mean For Investors?
Shan Dong Lu Bei ChemicalLtd's stock price has surged recently, but its but its P/S still remains modest. It's argued the price-to-sales ratio is an inferior measure of value within certain industries, but it can be a powerful business sentiment indicator.
As we suspected, our examination of Shan Dong Lu Bei ChemicalLtd revealed its three-year revenue trends are contributing to its low P/S, given they look worse than current industry expectations. At this stage investors feel the potential for an improvement in revenue isn't great enough to justify a higher P/S ratio. Unless the recent medium-term conditions improve, they will continue to form a barrier for the share price around these levels.
You should always think about risks. Case in point, we've spotted 2 warning signs for Shan Dong Lu Bei ChemicalLtd you should be aware of, and 1 of them shouldn't be ignored.
Of course, profitable companies with a history of great earnings growth are generally safer bets. So you may wish to see this free collection of other companies that have reasonable P/E ratios and have grown earnings strongly.
New: Manage All Your Stock Portfolios in One Place
We've created the ultimate portfolio companion for stock investors, and it's free.
• Connect an unlimited number of Portfolios and see your total in one currency
• Be alerted to new Warning Signs or Risks via email or mobile
• Track the Fair Value of your stocks
Have feedback on this article? Concerned about the content? Get in touch with us directly. Alternatively, email editorial-team (at) simplywallst.com.
This article by Simply Wall St is general in nature. We provide commentary based on historical data and analyst forecasts only using an unbiased methodology and our articles are not intended to be financial advice. It does not constitute a recommendation to buy or sell any stock, and does not take account of your objectives, or your financial situation. We aim to bring you long-term focused analysis driven by fundamental data. Note that our analysis may not factor in the latest price-sensitive company announcements or qualitative material. Simply Wall St has no position in any stocks mentioned.
About SHSE:600727
Shan Dong Lu Bei ChemicalLtd
Produces and sells various fertilizers and chemicals in China.
Adequate balance sheet with low risk.
Market Insights

Advertisement
Community Narratives
MicroVision will explode future revenue by 380.37% with a vision towards success
Fair Value US$60.00|98.4% undervalued
TH
Community Contributor
The Indispensable Artery for a New North American Economy
Fair Value CA$132.87|1.3% undervalued
TI
Community Contributor