
Advertisement
- China
- /
- Basic Materials
- /
- SHSE:600678
With A 25% Price Drop For Sichuan Golden Summit (group) Joint-Stock Co., Ltd. (SHSE:600678) You'll Still Get What You Pay For
The Sichuan Golden Summit (group) Joint-Stock Co., Ltd. (SHSE:600678) share price has fared very poorly over the last month, falling by a substantial 25%. The drop over the last 30 days has capped off a tough year for shareholders, with the share price down 11% in that time.
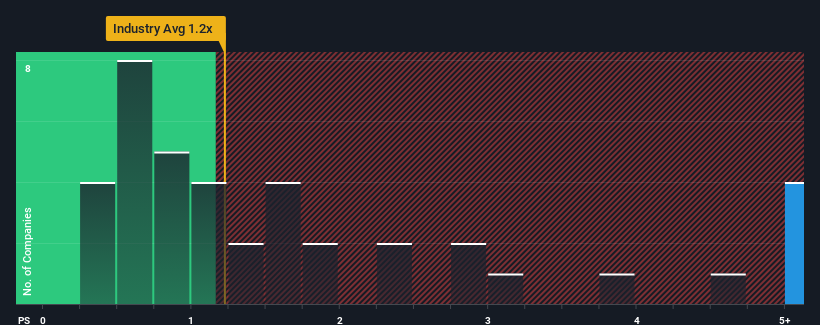
Even after such a large drop in price, you could still be forgiven for thinking Sichuan Golden Summit (group) is a stock to steer clear of with a price-to-sales ratios (or "P/S") of 5.2x, considering almost half the companies in China's Basic Materials industry have P/S ratios below 1.2x. However, the P/S might be quite high for a reason and it requires further investigation to determine if it's justified.
Check out our latest analysis for Sichuan Golden Summit (group)
How Sichuan Golden Summit (group) Has Been Performing
For example, consider that Sichuan Golden Summit (group)'s financial performance has been poor lately as its revenue has been in decline. It might be that many expect the company to still outplay most other companies over the coming period, which has kept the P/S from collapsing. However, if this isn't the case, investors might get caught out paying too much for the stock.
Although there are no analyst estimates available for Sichuan Golden Summit (group), take a look at this free data-rich visualisation to see how the company stacks up on earnings, revenue and cash flow.How Is Sichuan Golden Summit (group)'s Revenue Growth Trending?
There's an inherent assumption that a company should far outperform the industry for P/S ratios like Sichuan Golden Summit (group)'s to be considered reasonable.
Taking a look back first, the company's revenue growth last year wasn't something to get excited about as it posted a disappointing decline of 5.5%. Still, the latest three year period has seen an excellent 39% overall rise in revenue, in spite of its unsatisfying short-term performance. So we can start by confirming that the company has generally done a very good job of growing revenue over that time, even though it had some hiccups along the way.
Comparing that to the industry, which is only predicted to deliver 6.9% growth in the next 12 months, the company's momentum is stronger based on recent medium-term annualised revenue results.
In light of this, it's understandable that Sichuan Golden Summit (group)'s P/S sits above the majority of other companies. It seems most investors are expecting this strong growth to continue and are willing to pay more for the stock.
What Does Sichuan Golden Summit (group)'s P/S Mean For Investors?
Even after such a strong price drop, Sichuan Golden Summit (group)'s P/S still exceeds the industry median significantly. It's argued the price-to-sales ratio is an inferior measure of value within certain industries, but it can be a powerful business sentiment indicator.
As we suspected, our examination of Sichuan Golden Summit (group) revealed its three-year revenue trends are contributing to its high P/S, given they look better than current industry expectations. At this stage investors feel the potential continued revenue growth in the future is great enough to warrant an inflated P/S. Barring any significant changes to the company's ability to make money, the share price should continue to be propped up.
And what about other risks? Every company has them, and we've spotted 5 warning signs for Sichuan Golden Summit (group) (of which 4 are concerning!) you should know about.
If companies with solid past earnings growth is up your alley, you may wish to see this free collection of other companies with strong earnings growth and low P/E ratios.
New: Manage All Your Stock Portfolios in One Place
We've created the ultimate portfolio companion for stock investors, and it's free.
• Connect an unlimited number of Portfolios and see your total in one currency
• Be alerted to new Warning Signs or Risks via email or mobile
• Track the Fair Value of your stocks
Have feedback on this article? Concerned about the content? Get in touch with us directly. Alternatively, email editorial-team (at) simplywallst.com.
This article by Simply Wall St is general in nature. We provide commentary based on historical data and analyst forecasts only using an unbiased methodology and our articles are not intended to be financial advice. It does not constitute a recommendation to buy or sell any stock, and does not take account of your objectives, or your financial situation. We aim to bring you long-term focused analysis driven by fundamental data. Note that our analysis may not factor in the latest price-sensitive company announcements or qualitative material. Simply Wall St has no position in any stocks mentioned.
About SHSE:600678
Sichuan Golden Summit (group)
Sichuan Golden Summit (group) Joint-Stock Co., Ltd.
Mediocre balance sheet with low risk.
Market Insights

Advertisement
Community Narratives
MicroVision will explode future revenue by 380.37% with a vision towards success
Fair Value US$60.00|98.5% undervalued
TH
Community Contributor
The Indispensable Artery for a New North American Economy
Fair Value CA$132.87|2.3% undervalued
TI
Community Contributor