
Advertisement
- China
- /
- Basic Materials
- /
- SHSE:600678
Some Investors May Be Worried About Sichuan Golden Summit (group)'s (SHSE:600678) Returns On Capital
When we're researching a company, it's sometimes hard to find the warning signs, but there are some financial metrics that can help spot trouble early. When we see a declining return on capital employed (ROCE) in conjunction with a declining base of capital employed, that's often how a mature business shows signs of aging. This indicates the company is producing less profit from its investments and its total assets are decreasing. In light of that, from a first glance at Sichuan Golden Summit (group) (SHSE:600678), we've spotted some signs that it could be struggling, so let's investigate.
What Is Return On Capital Employed (ROCE)?
For those that aren't sure what ROCE is, it measures the amount of pre-tax profits a company can generate from the capital employed in its business. To calculate this metric for Sichuan Golden Summit (group), this is the formula:
Return on Capital Employed = Earnings Before Interest and Tax (EBIT) ÷ (Total Assets - Current Liabilities)
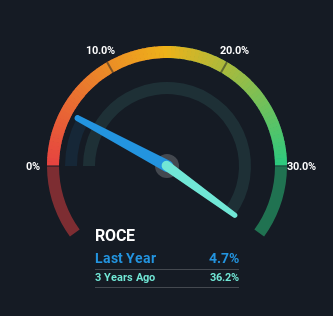
0.047 = CN¥26m ÷ (CN¥799m - CN¥254m) (Based on the trailing twelve months to September 2023).
So, Sichuan Golden Summit (group) has an ROCE of 4.7%. In absolute terms, that's a low return and it also under-performs the Basic Materials industry average of 6.1%.
View our latest analysis for Sichuan Golden Summit (group)
While the past is not representative of the future, it can be helpful to know how a company has performed historically, which is why we have this chart above. If you want to delve into the historical earnings , check out these free graphs detailing revenue and cash flow performance of Sichuan Golden Summit (group).
The Trend Of ROCE
In terms of Sichuan Golden Summit (group)'s historical ROCE movements, the trend doesn't inspire confidence. Unfortunately the returns on capital have diminished from the 9.3% that they were earning five years ago. Meanwhile, capital employed in the business has stayed roughly the flat over the period. Since returns are falling and the business has the same amount of assets employed, this can suggest it's a mature business that hasn't had much growth in the last five years. If these trends continue, we wouldn't expect Sichuan Golden Summit (group) to turn into a multi-bagger.
On a side note, Sichuan Golden Summit (group)'s current liabilities have increased over the last five years to 32% of total assets, effectively distorting the ROCE to some degree. If current liabilities hadn't increased as much as they did, the ROCE could actually be even lower. Keep an eye on this ratio, because the business could encounter some new risks if this metric gets too high.
The Bottom Line On Sichuan Golden Summit (group)'s ROCE
All in all, the lower returns from the same amount of capital employed aren't exactly signs of a compounding machine. Long term shareholders who've owned the stock over the last five years have experienced a 14% depreciation in their investment, so it appears the market might not like these trends either. That being the case, unless the underlying trends revert to a more positive trajectory, we'd consider looking elsewhere.
If you'd like to know more about Sichuan Golden Summit (group), we've spotted 5 warning signs, and 4 of them are a bit concerning.
If you want to search for solid companies with great earnings, check out this free list of companies with good balance sheets and impressive returns on equity.
New: Manage All Your Stock Portfolios in One Place
We've created the ultimate portfolio companion for stock investors, and it's free.
• Connect an unlimited number of Portfolios and see your total in one currency
• Be alerted to new Warning Signs or Risks via email or mobile
• Track the Fair Value of your stocks
Have feedback on this article? Concerned about the content? Get in touch with us directly. Alternatively, email editorial-team (at) simplywallst.com.
This article by Simply Wall St is general in nature. We provide commentary based on historical data and analyst forecasts only using an unbiased methodology and our articles are not intended to be financial advice. It does not constitute a recommendation to buy or sell any stock, and does not take account of your objectives, or your financial situation. We aim to bring you long-term focused analysis driven by fundamental data. Note that our analysis may not factor in the latest price-sensitive company announcements or qualitative material. Simply Wall St has no position in any stocks mentioned.
About SHSE:600678
Sichuan Golden Summit (group)
Sichuan Golden Summit (group) Joint-Stock Co., Ltd.
Mediocre balance sheet with low risk.
Market Insights

Advertisement
Community Narratives
MicroVision will explode future revenue by 380.37% with a vision towards success
Fair Value US$60.00|98.4% undervalued
TH
Community Contributor
The Indispensable Artery for a New North American Economy
Fair Value CA$132.87|1.1% undervalued
TI
Community Contributor