- China
- /
- Metals and Mining
- /
- SHSE:600549
Xiamen TungstenLtd's (SHSE:600549) underlying earnings growth outpaced the return generated for shareholders over the past five years


Stock pickers are generally looking for stocks that will outperform the broader market. And the truth is, you can make significant gains if you buy good quality businesses at the right price. For example, long term Xiamen Tungsten Co.,Ltd. (SHSE:600549) shareholders have enjoyed a 18% share price rise over the last half decade, well in excess of the market return of around 8.2% (not including dividends). However, more recent returns haven't been as impressive as that, with the stock returning just 2.0% in the last year, including dividends.
While the stock has fallen 4.0% this week, it's worth focusing on the longer term and seeing if the stocks historical returns have been driven by the underlying fundamentals.
Check out our latest analysis for Xiamen TungstenLtd
There is no denying that markets are sometimes efficient, but prices do not always reflect underlying business performance. One way to examine how market sentiment has changed over time is to look at the interaction between a company's share price and its earnings per share (EPS).
During five years of share price growth, Xiamen TungstenLtd achieved compound earnings per share (EPS) growth of 29% per year. This EPS growth is higher than the 3% average annual increase in the share price. So one could conclude that the broader market has become more cautious towards the stock.
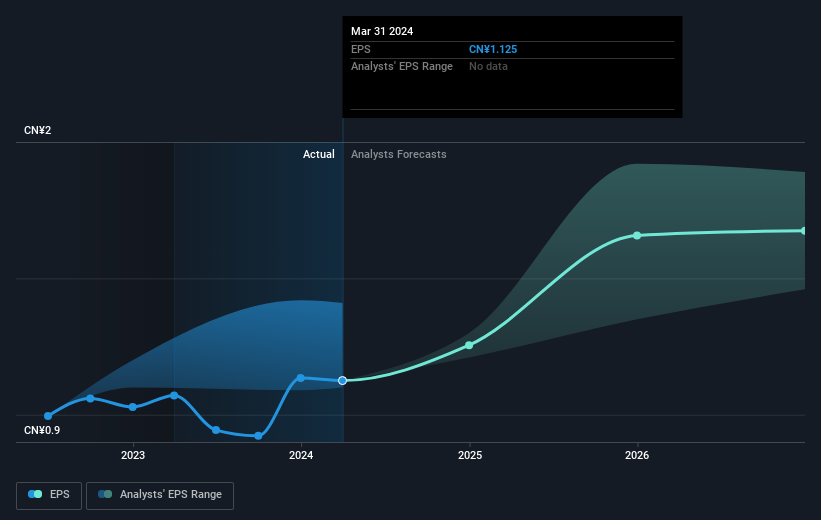
You can see how EPS has changed over time in the image below (click on the chart to see the exact values).
Dive deeper into Xiamen TungstenLtd's key metrics by checking this interactive graph of Xiamen TungstenLtd's earnings, revenue and cash flow.
What About Dividends?
When looking at investment returns, it is important to consider the difference between total shareholder return (TSR) and share price return. The TSR is a return calculation that accounts for the value of cash dividends (assuming that any dividend received was reinvested) and the calculated value of any discounted capital raisings and spin-offs. So for companies that pay a generous dividend, the TSR is often a lot higher than the share price return. In the case of Xiamen TungstenLtd, it has a TSR of 28% for the last 5 years. That exceeds its share price return that we previously mentioned. This is largely a result of its dividend payments!
A Different Perspective
It's good to see that Xiamen TungstenLtd has rewarded shareholders with a total shareholder return of 2.0% in the last twelve months. And that does include the dividend. However, the TSR over five years, coming in at 5% per year, is even more impressive. Potential buyers might understandably feel they've missed the opportunity, but it's always possible business is still firing on all cylinders. It's always interesting to track share price performance over the longer term. But to understand Xiamen TungstenLtd better, we need to consider many other factors. Even so, be aware that Xiamen TungstenLtd is showing 2 warning signs in our investment analysis , you should know about...
If you would prefer to check out another company -- one with potentially superior financials -- then do not miss this free list of companies that have proven they can grow earnings.
Please note, the market returns quoted in this article reflect the market weighted average returns of stocks that currently trade on Chinese exchanges.
New: AI Stock Screener & Alerts
Our new AI Stock Screener scans the market every day to uncover opportunities.
• Dividend Powerhouses (3%+ Yield)
• Undervalued Small Caps with Insider Buying
• High growth Tech and AI Companies
Or build your own from over 50 metrics.
Have feedback on this article? Concerned about the content? Get in touch with us directly. Alternatively, email editorial-team (at) simplywallst.com.
This article by Simply Wall St is general in nature. We provide commentary based on historical data and analyst forecasts only using an unbiased methodology and our articles are not intended to be financial advice. It does not constitute a recommendation to buy or sell any stock, and does not take account of your objectives, or your financial situation. We aim to bring you long-term focused analysis driven by fundamental data. Note that our analysis may not factor in the latest price-sensitive company announcements or qualitative material. Simply Wall St has no position in any stocks mentioned.
About SHSE:600549
Xiamen TungstenLtd
Engages in mining, smelting, downstream processing, and secondary resource recovery of tungsten, molybdenum, and rare earth metals in China.
Undervalued with solid track record and pays a dividend.
