- China
- /
- Metals and Mining
- /
- SHSE:600549
Xiamen TungstenLtd's (SHSE:600549) five-year total shareholder returns outpace the underlying earnings growth


When we invest, we're generally looking for stocks that outperform the market average. Buying under-rated businesses is one path to excess returns. For example, long term Xiamen Tungsten Co.,Ltd. (SHSE:600549) shareholders have enjoyed a 46% share price rise over the last half decade, well in excess of the market return of around 11% (not including dividends). However, more recent returns haven't been as impressive as that, with the stock returning just 16% in the last year, including dividends.
While this past week has detracted from the company's five-year return, let's look at the recent trends of the underlying business and see if the gains have been in alignment.
See our latest analysis for Xiamen TungstenLtd
While markets are a powerful pricing mechanism, share prices reflect investor sentiment, not just underlying business performance. One imperfect but simple way to consider how the market perception of a company has shifted is to compare the change in the earnings per share (EPS) with the share price movement.
During five years of share price growth, Xiamen TungstenLtd achieved compound earnings per share (EPS) growth of 50% per year. The EPS growth is more impressive than the yearly share price gain of 8% over the same period. So one could conclude that the broader market has become more cautious towards the stock.
You can see below how EPS has changed over time (discover the exact values by clicking on the image).
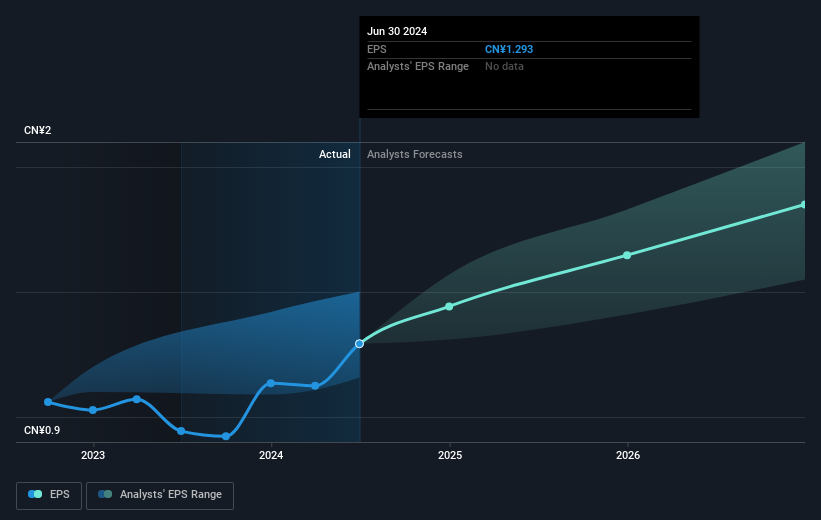
We know that Xiamen TungstenLtd has improved its bottom line lately, but is it going to grow revenue? This free report showing analyst revenue forecasts should help you figure out if the EPS growth can be sustained.
What About Dividends?
When looking at investment returns, it is important to consider the difference between total shareholder return (TSR) and share price return. The TSR incorporates the value of any spin-offs or discounted capital raisings, along with any dividends, based on the assumption that the dividends are reinvested. Arguably, the TSR gives a more comprehensive picture of the return generated by a stock. As it happens, Xiamen TungstenLtd's TSR for the last 5 years was 56%, which exceeds the share price return mentioned earlier. This is largely a result of its dividend payments!
A Different Perspective
It's good to see that Xiamen TungstenLtd has rewarded shareholders with a total shareholder return of 16% in the last twelve months. That's including the dividend. That gain is better than the annual TSR over five years, which is 9%. Therefore it seems like sentiment around the company has been positive lately. In the best case scenario, this may hint at some real business momentum, implying that now could be a great time to delve deeper. It's always interesting to track share price performance over the longer term. But to understand Xiamen TungstenLtd better, we need to consider many other factors. Take risks, for example - Xiamen TungstenLtd has 2 warning signs we think you should be aware of.
But note: Xiamen TungstenLtd may not be the best stock to buy. So take a peek at this free list of interesting companies with past earnings growth (and further growth forecast).
Please note, the market returns quoted in this article reflect the market weighted average returns of stocks that currently trade on Chinese exchanges.
New: AI Stock Screener & Alerts
Our new AI Stock Screener scans the market every day to uncover opportunities.
• Dividend Powerhouses (3%+ Yield)
• Undervalued Small Caps with Insider Buying
• High growth Tech and AI Companies
Or build your own from over 50 metrics.
Have feedback on this article? Concerned about the content? Get in touch with us directly. Alternatively, email editorial-team (at) simplywallst.com.
This article by Simply Wall St is general in nature. We provide commentary based on historical data and analyst forecasts only using an unbiased methodology and our articles are not intended to be financial advice. It does not constitute a recommendation to buy or sell any stock, and does not take account of your objectives, or your financial situation. We aim to bring you long-term focused analysis driven by fundamental data. Note that our analysis may not factor in the latest price-sensitive company announcements or qualitative material. Simply Wall St has no position in any stocks mentioned.
About SHSE:600549
Xiamen TungstenLtd
Engages in mining, smelting, downstream processing, and secondary resource recovery of tungsten, molybdenum, and rare earth metals in China.
Undervalued with solid track record and pays a dividend.
