
Advertisement
A Look At The Fair Value Of Tangshan Sanyou Chemical Industries Co.,Ltd (SHSE:600409)
Key Insights
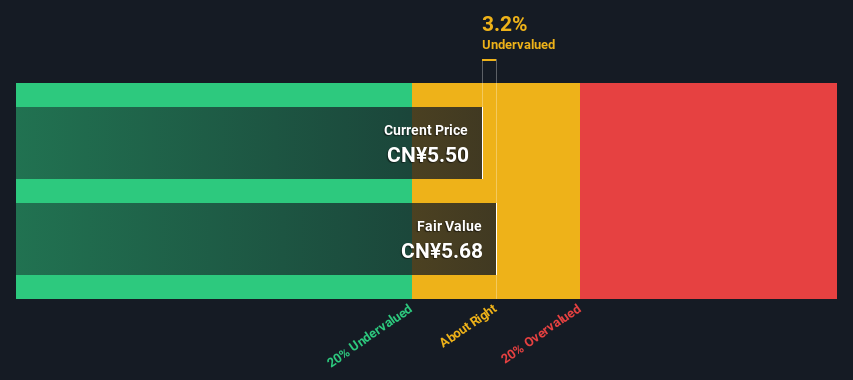
- Using the 2 Stage Free Cash Flow to Equity, Tangshan Sanyou Chemical IndustriesLtd fair value estimate is CN¥5.68
- With CN¥5.50 share price, Tangshan Sanyou Chemical IndustriesLtd appears to be trading close to its estimated fair value
- Peers of Tangshan Sanyou Chemical IndustriesLtd are currently trading on average at a 447% premium
Today we'll do a simple run through of a valuation method used to estimate the attractiveness of Tangshan Sanyou Chemical Industries Co.,Ltd (SHSE:600409) as an investment opportunity by estimating the company's future cash flows and discounting them to their present value. We will use the Discounted Cash Flow (DCF) model on this occasion. Believe it or not, it's not too difficult to follow, as you'll see from our example!
We generally believe that a company's value is the present value of all of the cash it will generate in the future. However, a DCF is just one valuation metric among many, and it is not without flaws. If you still have some burning questions about this type of valuation, take a look at the Simply Wall St analysis model.
Check out our latest analysis for Tangshan Sanyou Chemical IndustriesLtd
Step By Step Through The Calculation
We're using the 2-stage growth model, which simply means we take in account two stages of company's growth. In the initial period the company may have a higher growth rate and the second stage is usually assumed to have a stable growth rate. To start off with, we need to estimate the next ten years of cash flows. Seeing as no analyst estimates of free cash flow are available to us, we have extrapolate the previous free cash flow (FCF) from the company's last reported value. We assume companies with shrinking free cash flow will slow their rate of shrinkage, and that companies with growing free cash flow will see their growth rate slow, over this period. We do this to reflect that growth tends to slow more in the early years than it does in later years.
A DCF is all about the idea that a dollar in the future is less valuable than a dollar today, so we need to discount the sum of these future cash flows to arrive at a present value estimate:
10-year free cash flow (FCF) estimate
| 2025 | 2026 | 2027 | 2028 | 2029 | 2030 | 2031 | 2032 | 2033 | 2034 | |
| Levered FCF (CN¥, Millions) | CN¥1.11b | CN¥981.5m | CN¥912.4m | CN¥875.4m | CN¥858.2m | CN¥853.9m | CN¥858.3m | CN¥868.8m | CN¥883.9m | CN¥902.3m |
| Growth Rate Estimate Source | Est @ -17.37% | Est @ -11.29% | Est @ -7.03% | Est @ -4.05% | Est @ -1.97% | Est @ -0.51% | Est @ 0.51% | Est @ 1.23% | Est @ 1.73% | Est @ 2.08% |
| Present Value (CN¥, Millions) Discounted @ 9.3% | CN¥1.0k | CN¥821 | CN¥698 | CN¥612 | CN¥549 | CN¥499 | CN¥459 | CN¥425 | CN¥395 | CN¥369 |
("Est" = FCF growth rate estimated by Simply Wall St)
Present Value of 10-year Cash Flow (PVCF) = CN¥5.8b
The second stage is also known as Terminal Value, this is the business's cash flow after the first stage. For a number of reasons a very conservative growth rate is used that cannot exceed that of a country's GDP growth. In this case we have used the 5-year average of the 10-year government bond yield (2.9%) to estimate future growth. In the same way as with the 10-year 'growth' period, we discount future cash flows to today's value, using a cost of equity of 9.3%.
Terminal Value (TV)= FCF2034 × (1 + g) ÷ (r – g) = CN¥902m× (1 + 2.9%) ÷ (9.3%– 2.9%) = CN¥14b
Present Value of Terminal Value (PVTV)= TV / (1 + r)10= CN¥14b÷ ( 1 + 9.3%)10= CN¥5.9b
The total value, or equity value, is then the sum of the present value of the future cash flows, which in this case is CN¥12b. The last step is to then divide the equity value by the number of shares outstanding. Compared to the current share price of CN¥5.5, the company appears about fair value at a 3.2% discount to where the stock price trades currently. Valuations are imprecise instruments though, rather like a telescope - move a few degrees and end up in a different galaxy. Do keep this in mind.
The Assumptions
The calculation above is very dependent on two assumptions. The first is the discount rate and the other is the cash flows. You don't have to agree with these inputs, I recommend redoing the calculations yourself and playing with them. The DCF also does not consider the possible cyclicality of an industry, or a company's future capital requirements, so it does not give a full picture of a company's potential performance. Given that we are looking at Tangshan Sanyou Chemical IndustriesLtd as potential shareholders, the cost of equity is used as the discount rate, rather than the cost of capital (or weighted average cost of capital, WACC) which accounts for debt. In this calculation we've used 9.3%, which is based on a levered beta of 1.145. Beta is a measure of a stock's volatility, compared to the market as a whole. We get our beta from the industry average beta of globally comparable companies, with an imposed limit between 0.8 and 2.0, which is a reasonable range for a stable business.
SWOT Analysis for Tangshan Sanyou Chemical IndustriesLtd
Strength
- Earnings growth over the past year exceeded the industry.
- Debt is not viewed as a risk.
- Dividends are covered by earnings and cash flows.
Weakness
- Dividend is low compared to the top 25% of dividend payers in the Chemicals market.
Opportunity
- Annual earnings are forecast to grow for the next 3 years.
- Good value based on P/E ratio and estimated fair value.
Threat
- No apparent threats visible for 600409.
Next Steps:
Valuation is only one side of the coin in terms of building your investment thesis, and it is only one of many factors that you need to assess for a company. DCF models are not the be-all and end-all of investment valuation. Instead the best use for a DCF model is to test certain assumptions and theories to see if they would lead to the company being undervalued or overvalued. If a company grows at a different rate, or if its cost of equity or risk free rate changes sharply, the output can look very different. For Tangshan Sanyou Chemical IndustriesLtd, we've put together three relevant elements you should consider:
- Risks: We feel that you should assess the 1 warning sign for Tangshan Sanyou Chemical IndustriesLtd we've flagged before making an investment in the company.
- Future Earnings: How does 600409's growth rate compare to its peers and the wider market? Dig deeper into the analyst consensus number for the upcoming years by interacting with our free analyst growth expectation chart.
- Other High Quality Alternatives: Do you like a good all-rounder? Explore our interactive list of high quality stocks to get an idea of what else is out there you may be missing!
PS. The Simply Wall St app conducts a discounted cash flow valuation for every stock on the SHSE every day. If you want to find the calculation for other stocks just search here.
Valuation is complex, but we're here to simplify it.
Discover if Tangshan Sanyou Chemical IndustriesLtd might be undervalued or overvalued with our detailed analysis, featuring fair value estimates, potential risks, dividends, insider trades, and its financial condition.
Access Free AnalysisHave feedback on this article? Concerned about the content? Get in touch with us directly. Alternatively, email editorial-team (at) simplywallst.com.
This article by Simply Wall St is general in nature. We provide commentary based on historical data and analyst forecasts only using an unbiased methodology and our articles are not intended to be financial advice. It does not constitute a recommendation to buy or sell any stock, and does not take account of your objectives, or your financial situation. We aim to bring you long-term focused analysis driven by fundamental data. Note that our analysis may not factor in the latest price-sensitive company announcements or qualitative material. Simply Wall St has no position in any stocks mentioned.
Have feedback on this article? Concerned about the content? Get in touch with us directly. Alternatively, email editorial-team@simplywallst.com
About SHSE:600409
Tangshan Sanyou Chemical IndustriesLtd
Engages in the production and sales of calcium chloride, sodium chloride, and snow melting agent in the People's Republic of China.
Adequate balance sheet with moderate growth potential.
Similar Companies
Market Insights

Advertisement
Community Narratives
MicroVision will explode future revenue by 380.37% with a vision towards success
Fair Value US$60.00|98.3% undervalued
TH
Community Contributor
The Indispensable Artery for a New North American Economy
Fair Value CA$132.87|1.0% undervalued
TI
Community Contributor