
Advertisement
- China
- /
- Metals and Mining
- /
- SHSE:600331
Would Sichuan HongdaLtd (SHSE:600331) Be Better Off With Less Debt?
Warren Buffett famously said, 'Volatility is far from synonymous with risk.' So it seems the smart money knows that debt - which is usually involved in bankruptcies - is a very important factor, when you assess how risky a company is. We note that Sichuan Hongda Co.,Ltd (SHSE:600331) does have debt on its balance sheet. But the more important question is: how much risk is that debt creating?
What Risk Does Debt Bring?
Generally speaking, debt only becomes a real problem when a company can't easily pay it off, either by raising capital or with its own cash flow. Part and parcel of capitalism is the process of 'creative destruction' where failed businesses are mercilessly liquidated by their bankers. However, a more usual (but still expensive) situation is where a company must dilute shareholders at a cheap share price simply to get debt under control. Of course, the upside of debt is that it often represents cheap capital, especially when it replaces dilution in a company with the ability to reinvest at high rates of return. The first step when considering a company's debt levels is to consider its cash and debt together.
Check out our latest analysis for Sichuan HongdaLtd
What Is Sichuan HongdaLtd's Debt?
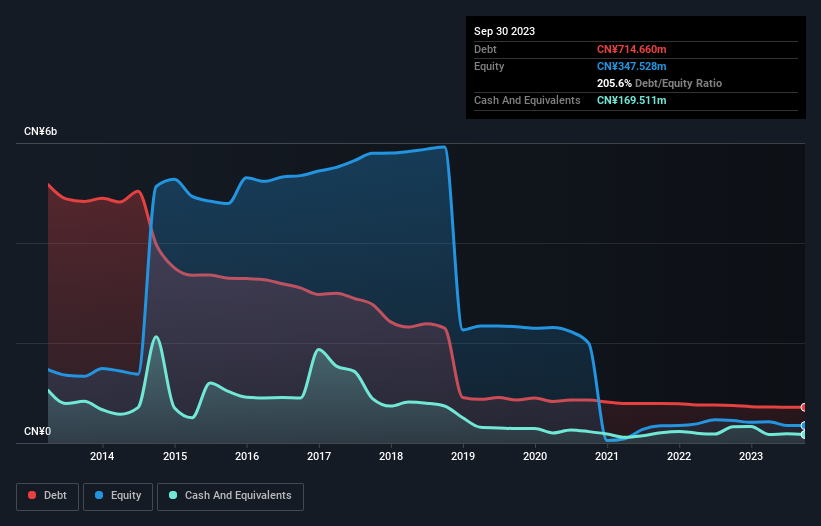
The image below, which you can click on for greater detail, shows that Sichuan HongdaLtd had debt of CN¥714.7m at the end of September 2023, a reduction from CN¥748.9m over a year. However, it also had CN¥169.5m in cash, and so its net debt is CN¥545.1m.
How Strong Is Sichuan HongdaLtd's Balance Sheet?
Zooming in on the latest balance sheet data, we can see that Sichuan HongdaLtd had liabilities of CN¥1.68b due within 12 months and liabilities of CN¥22.7m due beyond that. Offsetting these obligations, it had cash of CN¥169.5m as well as receivables valued at CN¥202.8m due within 12 months. So it has liabilities totalling CN¥1.33b more than its cash and near-term receivables, combined.
Since publicly traded Sichuan HongdaLtd shares are worth a total of CN¥11.3b, it seems unlikely that this level of liabilities would be a major threat. But there are sufficient liabilities that we would certainly recommend shareholders continue to monitor the balance sheet, going forward. When analysing debt levels, the balance sheet is the obvious place to start. But you can't view debt in total isolation; since Sichuan HongdaLtd will need earnings to service that debt. So when considering debt, it's definitely worth looking at the earnings trend. Click here for an interactive snapshot.
In the last year Sichuan HongdaLtd wasn't profitable at an EBIT level, but managed to grow its revenue by 13%, to CN¥3.2b. That rate of growth is a bit slow for our taste, but it takes all types to make a world.
Caveat Emptor
Over the last twelve months Sichuan HongdaLtd produced an earnings before interest and tax (EBIT) loss. To be specific the EBIT loss came in at CN¥20m. Considering that alongside the liabilities mentioned above does not give us much confidence that company should be using so much debt. Quite frankly we think the balance sheet is far from match-fit, although it could be improved with time. We would feel better if it turned its trailing twelve month loss of CN¥105m into a profit. So to be blunt we do think it is risky. When we look at a riskier company, we like to check how their profits (or losses) are trending over time. Today, we're providing readers this interactive graph showing how Sichuan HongdaLtd's profit, revenue, and operating cashflow have changed over the last few years.
If, after all that, you're more interested in a fast growing company with a rock-solid balance sheet, then check out our list of net cash growth stocks without delay.
New: Manage All Your Stock Portfolios in One Place
We've created the ultimate portfolio companion for stock investors, and it's free.
• Connect an unlimited number of Portfolios and see your total in one currency
• Be alerted to new Warning Signs or Risks via email or mobile
• Track the Fair Value of your stocks
Have feedback on this article? Concerned about the content? Get in touch with us directly. Alternatively, email editorial-team (at) simplywallst.com.
This article by Simply Wall St is general in nature. We provide commentary based on historical data and analyst forecasts only using an unbiased methodology and our articles are not intended to be financial advice. It does not constitute a recommendation to buy or sell any stock, and does not take account of your objectives, or your financial situation. We aim to bring you long-term focused analysis driven by fundamental data. Note that our analysis may not factor in the latest price-sensitive company announcements or qualitative material. Simply Wall St has no position in any stocks mentioned.
About SHSE:600331
Sichuan HongdaLtd
Engages in the production and sale of non-ferrous metal zinc smelting and phosphorous chemical products in China.
Flawless balance sheet with minimal risk.
Market Insights

Advertisement
Weekly Picks
FA

FAI on Arabian Internet and Communication Services ·
Solutions by stc: 34% Upside in Saudi's Digital Transformation Leader
Fair Value:ر.س342.2335.7% undervalued
9 followersusers have followed this narrative
1 commentusers have commented on this narrative
3 likesusers have liked this narrative
RO


RobertoAllende on NVIDIA ·
The AI Infrastructure Giant Grows Into Its Valuation
Fair Value:US$345.0747.9% undervalued
27 followersusers have followed this narrative
28 commentsusers have commented on this narrative
21 likesusers have liked this narrative
Recently Updated Narratives
TA


Talos on PayPal Holdings ·
The "Sleeping Giant" Wakes Up – Efficiency & Monetization
Fair Value:US$174.9264.2% undervalued
1 followerusers have followed this narrative
0 commentsusers have commented on this narrative
0 likesusers have liked this narrative
TA

Talos on Pagaya Technologies ·
The "Rate Cut" Supercycle Winner – Profitable & Accelerating
Fair Value:US$170.685.9% undervalued
1 followerusers have followed this narrative
0 commentsusers have commented on this narrative
0 likesusers have liked this narrative
TA

Talos on Archer Aviation ·
The Industrialist of the Skies – Scaling with "Automotive DNA
Fair Value:US$16.3254.3% undervalued
1 followerusers have followed this narrative
0 commentsusers have commented on this narrative
0 likesusers have liked this narrative
Popular Narratives
TH


TheWallstreetKing on MicroVision ·
MicroVision will explode future revenue by 380.37% with a vision towards success
Fair Value:US$6098.6% undervalued
110 followersusers have followed this narrative
11 commentsusers have commented on this narrative
22 likesusers have liked this narrative
AN

AnalystConsensusTarget on NVIDIA ·
NVDA: Expanding AI Demand Will Drive Major Data Center Investments Through 2026
Fair Value:US$250.3928.1% undervalued
945 followersusers have followed this narrative
6 commentsusers have commented on this narrative
24 likesusers have liked this narrative
OS


oscargarcia on Alphabet ·
The company that turned a verb into a global necessity and basically runs the modern internet, digital ads, smartphones, maps, and AI.
Fair Value:US$3407.4% undervalued
146 followersusers have followed this narrative
6 commentsusers have commented on this narrative
18 likesusers have liked this narrative