- China
- /
- Metals and Mining
- /
- SHSE:600219
Shandong Nanshan AluminiumLtd's (SHSE:600219) five-year earnings growth trails the notable shareholder returns

When we invest, we're generally looking for stocks that outperform the market average. And in our experience, buying the right stocks can give your wealth a significant boost. For example, long term Shandong Nanshan Aluminium Co.,Ltd. (SHSE:600219) shareholders have enjoyed a 75% share price rise over the last half decade, well in excess of the market decline of around 7.2% (not including dividends). On the other hand, the more recent gains haven't been so impressive, with shareholders gaining just 21%, including dividends.
Since the stock has added CN¥2.7b to its market cap in the past week alone, let's see if underlying performance has been driving long-term returns.
Check out our latest analysis for Shandong Nanshan AluminiumLtd
While markets are a powerful pricing mechanism, share prices reflect investor sentiment, not just underlying business performance. One way to examine how market sentiment has changed over time is to look at the interaction between a company's share price and its earnings per share (EPS).
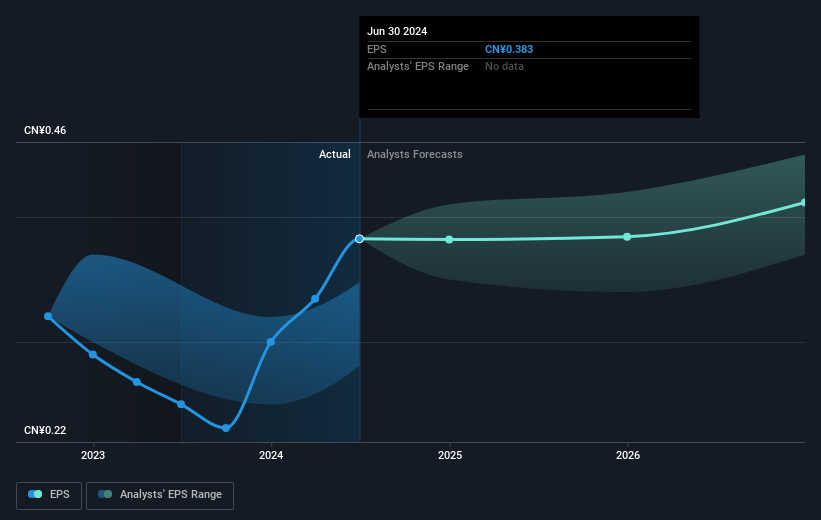
Over half a decade, Shandong Nanshan AluminiumLtd managed to grow its earnings per share at 25% a year. The EPS growth is more impressive than the yearly share price gain of 12% over the same period. Therefore, it seems the market has become relatively pessimistic about the company. The reasonably low P/E ratio of 10.01 also suggests market apprehension.
The company's earnings per share (over time) is depicted in the image below (click to see the exact numbers).
It's probably worth noting that the CEO is paid less than the median at similar sized companies. But while CEO remuneration is always worth checking, the really important question is whether the company can grow earnings going forward. This free interactive report on Shandong Nanshan AluminiumLtd's earnings, revenue and cash flow is a great place to start, if you want to investigate the stock further.
What About Dividends?
When looking at investment returns, it is important to consider the difference between total shareholder return (TSR) and share price return. The TSR incorporates the value of any spin-offs or discounted capital raisings, along with any dividends, based on the assumption that the dividends are reinvested. Arguably, the TSR gives a more comprehensive picture of the return generated by a stock. As it happens, Shandong Nanshan AluminiumLtd's TSR for the last 5 years was 94%, which exceeds the share price return mentioned earlier. This is largely a result of its dividend payments!
A Different Perspective
It's nice to see that Shandong Nanshan AluminiumLtd shareholders have received a total shareholder return of 21% over the last year. That's including the dividend. That gain is better than the annual TSR over five years, which is 14%. Therefore it seems like sentiment around the company has been positive lately. Someone with an optimistic perspective could view the recent improvement in TSR as indicating that the business itself is getting better with time. It's always interesting to track share price performance over the longer term. But to understand Shandong Nanshan AluminiumLtd better, we need to consider many other factors. For instance, we've identified 2 warning signs for Shandong Nanshan AluminiumLtd that you should be aware of.
But note: Shandong Nanshan AluminiumLtd may not be the best stock to buy. So take a peek at this free list of interesting companies with past earnings growth (and further growth forecast).
Please note, the market returns quoted in this article reflect the market weighted average returns of stocks that currently trade on Chinese exchanges.
New: Manage All Your Stock Portfolios in One Place
We've created the ultimate portfolio companion for stock investors, and it's free.
• Connect an unlimited number of Portfolios and see your total in one currency
• Be alerted to new Warning Signs or Risks via email or mobile
• Track the Fair Value of your stocks
Have feedback on this article? Concerned about the content? Get in touch with us directly. Alternatively, email editorial-team (at) simplywallst.com.
This article by Simply Wall St is general in nature. We provide commentary based on historical data and analyst forecasts only using an unbiased methodology and our articles are not intended to be financial advice. It does not constitute a recommendation to buy or sell any stock, and does not take account of your objectives, or your financial situation. We aim to bring you long-term focused analysis driven by fundamental data. Note that our analysis may not factor in the latest price-sensitive company announcements or qualitative material. Simply Wall St has no position in any stocks mentioned.
About SHSE:600219
Shandong Nanshan AluminiumLtd
Researches and develops, manufactures, imports, sells, and exports aluminum profiles worldwide.
Flawless balance sheet, undervalued and pays a dividend.

