- China
- /
- Healthcare Services
- /
- SZSE:301293
Is Sanbo Hospital Management Group Limited's (SZSE:301293) Recent Stock Performance Influenced By Its Fundamentals In Any Way?


Most readers would already be aware that Sanbo Hospital Management Group's (SZSE:301293) stock increased significantly by 44% over the past month. Given that stock prices are usually aligned with a company's financial performance in the long-term, we decided to study its financial indicators more closely to see if they had a hand to play in the recent price move. Particularly, we will be paying attention to Sanbo Hospital Management Group's ROE today.
Return on equity or ROE is a key measure used to assess how efficiently a company's management is utilizing the company's capital. Simply put, it is used to assess the profitability of a company in relation to its equity capital.
See our latest analysis for Sanbo Hospital Management Group
How To Calculate Return On Equity?
ROE can be calculated by using the formula:
Return on Equity = Net Profit (from continuing operations) ÷ Shareholders' Equity
So, based on the above formula, the ROE for Sanbo Hospital Management Group is:
4.3% = CN¥111m ÷ CN¥2.6b (Based on the trailing twelve months to June 2024).
The 'return' is the amount earned after tax over the last twelve months. Another way to think of that is that for every CN¥1 worth of equity, the company was able to earn CN¥0.04 in profit.
Why Is ROE Important For Earnings Growth?
Thus far, we have learned that ROE measures how efficiently a company is generating its profits. We now need to evaluate how much profit the company reinvests or "retains" for future growth which then gives us an idea about the growth potential of the company. Assuming everything else remains unchanged, the higher the ROE and profit retention, the higher the growth rate of a company compared to companies that don't necessarily bear these characteristics.
Sanbo Hospital Management Group's Earnings Growth And 4.3% ROE
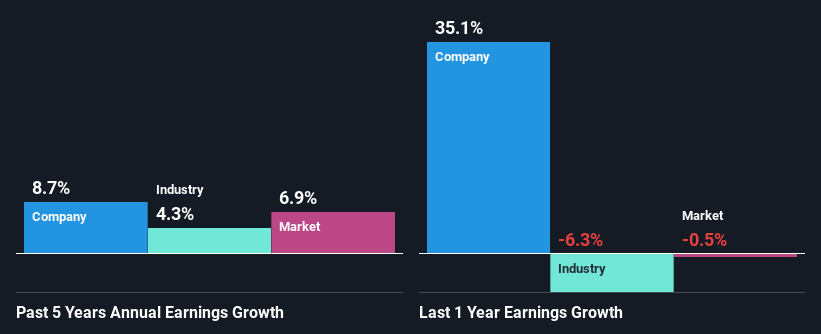
It is quite clear that Sanbo Hospital Management Group's ROE is rather low. Even when compared to the industry average of 6.5%, the ROE figure is pretty disappointing. However, the moderate 8.7% net income growth seen by Sanbo Hospital Management Group over the past five years is definitely a positive. Therefore, the growth in earnings could probably have been caused by other variables. For example, it is possible that the company's management has made some good strategic decisions, or that the company has a low payout ratio.
We then compared Sanbo Hospital Management Group's net income growth with the industry and we're pleased to see that the company's growth figure is higher when compared with the industry which has a growth rate of 4.3% in the same 5-year period.
Earnings growth is a huge factor in stock valuation. The investor should try to establish if the expected growth or decline in earnings, whichever the case may be, is priced in. Doing so will help them establish if the stock's future looks promising or ominous. One good indicator of expected earnings growth is the P/E ratio which determines the price the market is willing to pay for a stock based on its earnings prospects. So, you may want to check if Sanbo Hospital Management Group is trading on a high P/E or a low P/E, relative to its industry.
Is Sanbo Hospital Management Group Efficiently Re-investing Its Profits?
Sanbo Hospital Management Group has a low three-year median payout ratio of 17%, meaning that the company retains the remaining 83% of its profits. This suggests that the management is reinvesting most of the profits to grow the business.
Conclusion
On the whole, we do feel that Sanbo Hospital Management Group has some positive attributes. Even in spite of the low rate of return, the company has posted impressive earnings growth as a result of reinvesting heavily into its business.
New: Manage All Your Stock Portfolios in One Place
We've created the ultimate portfolio companion for stock investors, and it's free.
• Connect an unlimited number of Portfolios and see your total in one currency
• Be alerted to new Warning Signs or Risks via email or mobile
• Track the Fair Value of your stocks
Have feedback on this article? Concerned about the content? Get in touch with us directly. Alternatively, email editorial-team (at) simplywallst.com.
This article by Simply Wall St is general in nature. We provide commentary based on historical data and analyst forecasts only using an unbiased methodology and our articles are not intended to be financial advice. It does not constitute a recommendation to buy or sell any stock, and does not take account of your objectives, or your financial situation. We aim to bring you long-term focused analysis driven by fundamental data. Note that our analysis may not factor in the latest price-sensitive company announcements or qualitative material. Simply Wall St has no position in any stocks mentioned.
About SZSE:301293
Sanbo Hospital Management Group
Operates a network of hospitals that provide medical services.
Flawless balance sheet with solid track record.
