Shandong Xiantan Co., Ltd.'s (SZSE:002746) market cap increased by CN¥508m, insiders receive a 46% cut


Key Insights
- Shandong Xiantan's significant insider ownership suggests inherent interests in company's expansion
- 51% of the business is held by the top 3 shareholders
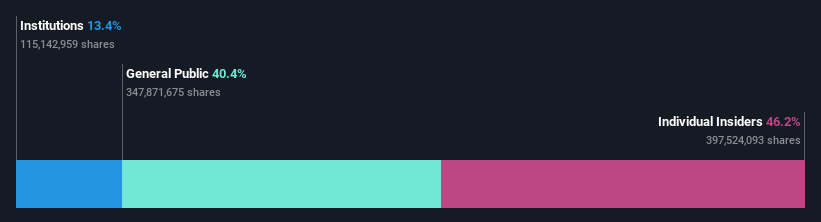
- Institutions own 13% of Shandong Xiantan
Every investor in Shandong Xiantan Co., Ltd. (SZSE:002746) should be aware of the most powerful shareholder groups. And the group that holds the biggest piece of the pie are individual insiders with 46% ownership. That is, the group stands to benefit the most if the stock rises (or lose the most if there is a downturn).
As a result, insiders were the biggest beneficiaries of last week’s 11% gain.
Let's take a closer look to see what the different types of shareholders can tell us about Shandong Xiantan.
See our latest analysis for Shandong Xiantan
What Does The Institutional Ownership Tell Us About Shandong Xiantan?
Institutions typically measure themselves against a benchmark when reporting to their own investors, so they often become more enthusiastic about a stock once it's included in a major index. We would expect most companies to have some institutions on the register, especially if they are growing.
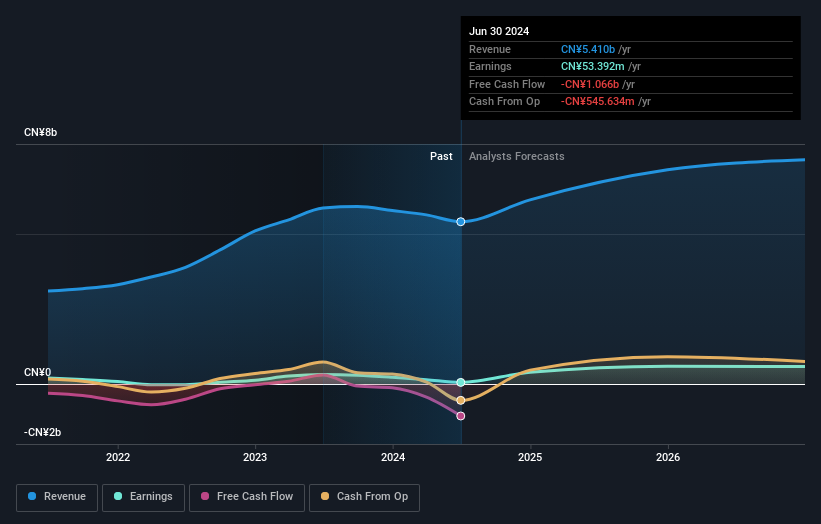
As you can see, institutional investors have a fair amount of stake in Shandong Xiantan. This implies the analysts working for those institutions have looked at the stock and they like it. But just like anyone else, they could be wrong. When multiple institutions own a stock, there's always a risk that they are in a 'crowded trade'. When such a trade goes wrong, multiple parties may compete to sell stock fast. This risk is higher in a company without a history of growth. You can see Shandong Xiantan's historic earnings and revenue below, but keep in mind there's always more to the story.
Shandong Xiantan is not owned by hedge funds. Shou Chun Wang is currently the company's largest shareholder with 25% of shares outstanding. In comparison, the second and third largest shareholders hold about 21% and 5.0% of the stock.
After doing some more digging, we found that the top 3 shareholders collectively control more than half of the company's shares, implying that they have considerable power to influence the company's decisions.
Researching institutional ownership is a good way to gauge and filter a stock's expected performance. The same can be achieved by studying analyst sentiments. While there is some analyst coverage, the company is probably not widely covered. So it could gain more attention, down the track.
Insider Ownership Of Shandong Xiantan
The definition of company insiders can be subjective and does vary between jurisdictions. Our data reflects individual insiders, capturing board members at the very least. The company management answer to the board and the latter should represent the interests of shareholders. Notably, sometimes top-level managers are on the board themselves.
Most consider insider ownership a positive because it can indicate the board is well aligned with other shareholders. However, on some occasions too much power is concentrated within this group.
Our most recent data indicates that insiders own a reasonable proportion of Shandong Xiantan Co., Ltd.. Insiders own CN¥2.3b worth of shares in the CN¥5.0b company. It is great to see insiders so invested in the business. It might be worth checking if those insiders have been buying recently.
General Public Ownership
With a 40% ownership, the general public, mostly comprising of individual investors, have some degree of sway over Shandong Xiantan. While this group can't necessarily call the shots, it can certainly have a real influence on how the company is run.
Next Steps:
It's always worth thinking about the different groups who own shares in a company. But to understand Shandong Xiantan better, we need to consider many other factors. For example, we've discovered 3 warning signs for Shandong Xiantan (2 are a bit unpleasant!) that you should be aware of before investing here.
Ultimately the future is most important. You can access this free report on analyst forecasts for the company.
NB: Figures in this article are calculated using data from the last twelve months, which refer to the 12-month period ending on the last date of the month the financial statement is dated. This may not be consistent with full year annual report figures.
New: Manage All Your Stock Portfolios in One Place
We've created the ultimate portfolio companion for stock investors, and it's free.
• Connect an unlimited number of Portfolios and see your total in one currency
• Be alerted to new Warning Signs or Risks via email or mobile
• Track the Fair Value of your stocks
Have feedback on this article? Concerned about the content? Get in touch with us directly. Alternatively, email editorial-team (at) simplywallst.com.
This article by Simply Wall St is general in nature. We provide commentary based on historical data and analyst forecasts only using an unbiased methodology and our articles are not intended to be financial advice. It does not constitute a recommendation to buy or sell any stock, and does not take account of your objectives, or your financial situation. We aim to bring you long-term focused analysis driven by fundamental data. Note that our analysis may not factor in the latest price-sensitive company announcements or qualitative material. Simply Wall St has no position in any stocks mentioned.
About SZSE:002746
Shandong Xiantan
Engages in breeder breeding, chick hatching, feed processing, broiler breeding, and slaughtering businesses primarily in China.
Moderate growth potential with mediocre balance sheet.

