- China
- /
- Electrical
- /
- SZSE:002733
Shenzhen Center Power Tech's (SZSE:002733) earnings have declined over five years, contributing to shareholders 39% loss


Shenzhen Center Power Tech. Co., Ltd (SZSE:002733) shareholders should be happy to see the share price up 11% in the last week. But that doesn't change the fact that the returns over the last five years have been less than pleasing. After all, the share price is down 41% in that time, significantly under-performing the market.
Although the past week has been more reassuring for shareholders, they're still in the red over the last five years, so let's see if the underlying business has been responsible for the decline.
Check out our latest analysis for Shenzhen Center Power Tech
There is no denying that markets are sometimes efficient, but prices do not always reflect underlying business performance. One way to examine how market sentiment has changed over time is to look at the interaction between a company's share price and its earnings per share (EPS).
Looking back five years, both Shenzhen Center Power Tech's share price and EPS declined; the latter at a rate of 8.4% per year. This change in EPS is reasonably close to the 10% average annual decrease in the share price. That suggests that the market sentiment around the company hasn't changed much over that time. Rather, the share price change has reflected changes in earnings per share.
You can see how EPS has changed over time in the image below (click on the chart to see the exact values).
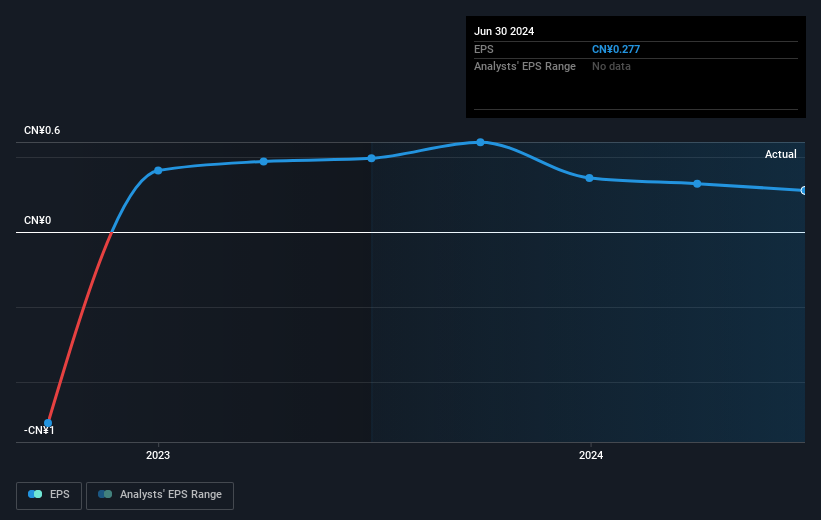
It might be well worthwhile taking a look at our free report on Shenzhen Center Power Tech's earnings, revenue and cash flow.
What About Dividends?
As well as measuring the share price return, investors should also consider the total shareholder return (TSR). The TSR is a return calculation that accounts for the value of cash dividends (assuming that any dividend received was reinvested) and the calculated value of any discounted capital raisings and spin-offs. It's fair to say that the TSR gives a more complete picture for stocks that pay a dividend. We note that for Shenzhen Center Power Tech the TSR over the last 5 years was -39%, which is better than the share price return mentioned above. And there's no prize for guessing that the dividend payments largely explain the divergence!
A Different Perspective
We regret to report that Shenzhen Center Power Tech shareholders are down 18% for the year (even including dividends). Unfortunately, that's worse than the broader market decline of 6.0%. Having said that, it's inevitable that some stocks will be oversold in a falling market. The key is to keep your eyes on the fundamental developments. Regrettably, last year's performance caps off a bad run, with the shareholders facing a total loss of 7% per year over five years. Generally speaking long term share price weakness can be a bad sign, though contrarian investors might want to research the stock in hope of a turnaround. It's always interesting to track share price performance over the longer term. But to understand Shenzhen Center Power Tech better, we need to consider many other factors. Consider for instance, the ever-present spectre of investment risk. We've identified 3 warning signs with Shenzhen Center Power Tech (at least 1 which is significant) , and understanding them should be part of your investment process.
But note: Shenzhen Center Power Tech may not be the best stock to buy. So take a peek at this free list of interesting companies with past earnings growth (and further growth forecast).
Please note, the market returns quoted in this article reflect the market weighted average returns of stocks that currently trade on Chinese exchanges.
New: Manage All Your Stock Portfolios in One Place
We've created the ultimate portfolio companion for stock investors, and it's free.
• Connect an unlimited number of Portfolios and see your total in one currency
• Be alerted to new Warning Signs or Risks via email or mobile
• Track the Fair Value of your stocks
Have feedback on this article? Concerned about the content? Get in touch with us directly. Alternatively, email editorial-team (at) simplywallst.com.
This article by Simply Wall St is general in nature. We provide commentary based on historical data and analyst forecasts only using an unbiased methodology and our articles are not intended to be financial advice. It does not constitute a recommendation to buy or sell any stock, and does not take account of your objectives, or your financial situation. We aim to bring you long-term focused analysis driven by fundamental data. Note that our analysis may not factor in the latest price-sensitive company announcements or qualitative material. Simply Wall St has no position in any stocks mentioned.
About SZSE:002733
Shenzhen Center Power Tech
Engages in the research and development, production, and sales of valve-regulated sealed lead-acid batteries, lithium-ion batteries, and fuel cells in China.
Excellent balance sheet second-rate dividend payer.

