- China
- /
- Consumer Durables
- /
- SZSE:002925
The three-year loss for Xiamen Intretech (SZSE:002925) shareholders likely driven by its shrinking earnings


The truth is that if you invest for long enough, you're going to end up with some losing stocks. But long term Xiamen Intretech Inc. (SZSE:002925) shareholders have had a particularly rough ride in the last three year. Sadly for them, the share price is down 69% in that time. And the ride hasn't got any smoother in recent times over the last year, with the price 34% lower in that time. Furthermore, it's down 14% in about a quarter. That's not much fun for holders.
On a more encouraging note the company has added CN¥566m to its market cap in just the last 7 days, so let's see if we can determine what's driven the three-year loss for shareholders.
Check out our latest analysis for Xiamen Intretech
While the efficient markets hypothesis continues to be taught by some, it has been proven that markets are over-reactive dynamic systems, and investors are not always rational. One way to examine how market sentiment has changed over time is to look at the interaction between a company's share price and its earnings per share (EPS).
Xiamen Intretech saw its EPS decline at a compound rate of 27% per year, over the last three years. This change in EPS is reasonably close to the 32% average annual decrease in the share price. So it seems like sentiment towards the stock hasn't changed all that much over time. Rather, the share price has approximately tracked EPS growth.
The company's earnings per share (over time) is depicted in the image below (click to see the exact numbers).
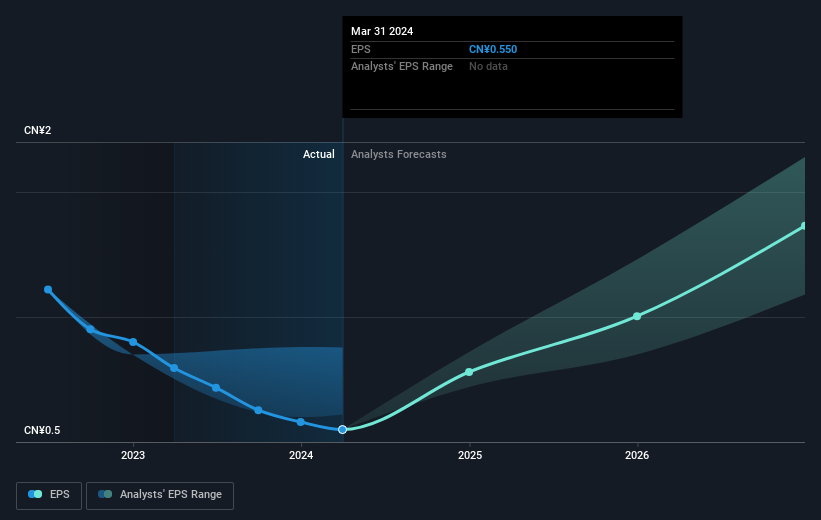
This free interactive report on Xiamen Intretech's earnings, revenue and cash flow is a great place to start, if you want to investigate the stock further.
What About Dividends?
When looking at investment returns, it is important to consider the difference between total shareholder return (TSR) and share price return. The TSR incorporates the value of any spin-offs or discounted capital raisings, along with any dividends, based on the assumption that the dividends are reinvested. It's fair to say that the TSR gives a more complete picture for stocks that pay a dividend. In the case of Xiamen Intretech, it has a TSR of -65% for the last 3 years. That exceeds its share price return that we previously mentioned. This is largely a result of its dividend payments!
A Different Perspective
We regret to report that Xiamen Intretech shareholders are down 32% for the year (even including dividends). Unfortunately, that's worse than the broader market decline of 17%. However, it could simply be that the share price has been impacted by broader market jitters. It might be worth keeping an eye on the fundamentals, in case there's a good opportunity. Unfortunately, last year's performance may indicate unresolved challenges, given that it was worse than the annualised loss of 6% over the last half decade. Generally speaking long term share price weakness can be a bad sign, though contrarian investors might want to research the stock in hope of a turnaround. It's always interesting to track share price performance over the longer term. But to understand Xiamen Intretech better, we need to consider many other factors. Take risks, for example - Xiamen Intretech has 1 warning sign we think you should be aware of.
But note: Xiamen Intretech may not be the best stock to buy. So take a peek at this free list of interesting companies with past earnings growth (and further growth forecast).
Please note, the market returns quoted in this article reflect the market weighted average returns of stocks that currently trade on Chinese exchanges.
New: AI Stock Screener & Alerts
Our new AI Stock Screener scans the market every day to uncover opportunities.
• Dividend Powerhouses (3%+ Yield)
• Undervalued Small Caps with Insider Buying
• High growth Tech and AI Companies
Or build your own from over 50 metrics.
Have feedback on this article? Concerned about the content? Get in touch with us directly. Alternatively, email editorial-team (at) simplywallst.com.
This article by Simply Wall St is general in nature. We provide commentary based on historical data and analyst forecasts only using an unbiased methodology and our articles are not intended to be financial advice. It does not constitute a recommendation to buy or sell any stock, and does not take account of your objectives, or your financial situation. We aim to bring you long-term focused analysis driven by fundamental data. Note that our analysis may not factor in the latest price-sensitive company announcements or qualitative material. Simply Wall St has no position in any stocks mentioned.
Have feedback on this article? Concerned about the content? Get in touch with us directly. Alternatively, email editorial-team@simplywallst.com
About SZSE:002925
Xiamen Intretech
Designs, produces, and sells intelligent control components, consumer electronic products, and intelligent manufacturing solutions in China and internationally.
High growth potential with excellent balance sheet.
