- China
- /
- Consumer Durables
- /
- SZSE:002779
Investors Appear Satisfied With Zhejiang Zhongjian Technology Co.,Ltd's (SZSE:002779) Prospects As Shares Rocket 34%
Despite an already strong run, Zhejiang Zhongjian Technology Co.,Ltd (SZSE:002779) shares have been powering on, with a gain of 34% in the last thirty days. The last month tops off a massive increase of 101% in the last year.
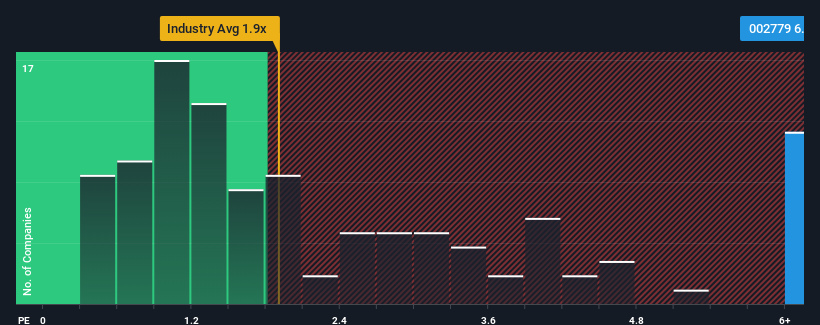
Following the firm bounce in price, when almost half of the companies in China's Consumer Durables industry have price-to-sales ratios (or "P/S") below 1.9x, you may consider Zhejiang Zhongjian TechnologyLtd as a stock not worth researching with its 6.6x P/S ratio. Nonetheless, we'd need to dig a little deeper to determine if there is a rational basis for the highly elevated P/S.
See our latest analysis for Zhejiang Zhongjian TechnologyLtd

How Zhejiang Zhongjian TechnologyLtd Has Been Performing
Zhejiang Zhongjian TechnologyLtd certainly has been doing a great job lately as it's been growing its revenue at a really rapid pace. It seems that many are expecting the strong revenue performance to beat most other companies over the coming period, which has increased investors’ willingness to pay up for the stock. If not, then existing shareholders might be a little nervous about the viability of the share price.
We don't have analyst forecasts, but you can see how recent trends are setting up the company for the future by checking out our free report on Zhejiang Zhongjian TechnologyLtd's earnings, revenue and cash flow.What Are Revenue Growth Metrics Telling Us About The High P/S?
There's an inherent assumption that a company should far outperform the industry for P/S ratios like Zhejiang Zhongjian TechnologyLtd's to be considered reasonable.
Retrospectively, the last year delivered an exceptional 32% gain to the company's top line. The strong recent performance means it was also able to grow revenue by 74% in total over the last three years. Therefore, it's fair to say the revenue growth recently has been superb for the company.
When compared to the industry's one-year growth forecast of 9.3%, the most recent medium-term revenue trajectory is noticeably more alluring
With this in consideration, it's not hard to understand why Zhejiang Zhongjian TechnologyLtd's P/S is high relative to its industry peers. It seems most investors are expecting this strong growth to continue and are willing to pay more for the stock.
The Bottom Line On Zhejiang Zhongjian TechnologyLtd's P/S
Zhejiang Zhongjian TechnologyLtd's P/S has grown nicely over the last month thanks to a handy boost in the share price. Typically, we'd caution against reading too much into price-to-sales ratios when settling on investment decisions, though it can reveal plenty about what other market participants think about the company.
It's no surprise that Zhejiang Zhongjian TechnologyLtd can support its high P/S given the strong revenue growth its experienced over the last three-year is superior to the current industry outlook. In the eyes of shareholders, the probability of a continued growth trajectory is great enough to prevent the P/S from pulling back. Unless the recent medium-term conditions change, they will continue to provide strong support to the share price.
Many other vital risk factors can be found on the company's balance sheet. Our free balance sheet analysis for Zhejiang Zhongjian TechnologyLtd with six simple checks will allow you to discover any risks that could be an issue.
Of course, profitable companies with a history of great earnings growth are generally safer bets. So you may wish to see this free collection of other companies that have reasonable P/E ratios and have grown earnings strongly.
Valuation is complex, but we're here to simplify it.
Discover if Zhejiang Zhongjian TechnologyLtd might be undervalued or overvalued with our detailed analysis, featuring fair value estimates, potential risks, dividends, insider trades, and its financial condition.
Access Free AnalysisHave feedback on this article? Concerned about the content? Get in touch with us directly. Alternatively, email editorial-team (at) simplywallst.com.
This article by Simply Wall St is general in nature. We provide commentary based on historical data and analyst forecasts only using an unbiased methodology and our articles are not intended to be financial advice. It does not constitute a recommendation to buy or sell any stock, and does not take account of your objectives, or your financial situation. We aim to bring you long-term focused analysis driven by fundamental data. Note that our analysis may not factor in the latest price-sensitive company announcements or qualitative material. Simply Wall St has no position in any stocks mentioned.
About SZSE:002779
Zhejiang Zhongjian TechnologyLtd
Engages in the research and development, production, and sale of various garden machinery products in China and internationally.
Adequate balance sheet with moderate growth potential.
Market Insights
Community Narratives


