
Advertisement
Earnings Not Telling The Story For Kuangda Technology Group Co., Ltd. (SZSE:002516) After Shares Rise 29%
Those holding Kuangda Technology Group Co., Ltd. (SZSE:002516) shares would be relieved that the share price has rebounded 29% in the last thirty days, but it needs to keep going to repair the recent damage it has caused to investor portfolios. Not all shareholders will be feeling jubilant, since the share price is still down a very disappointing 16% in the last twelve months.
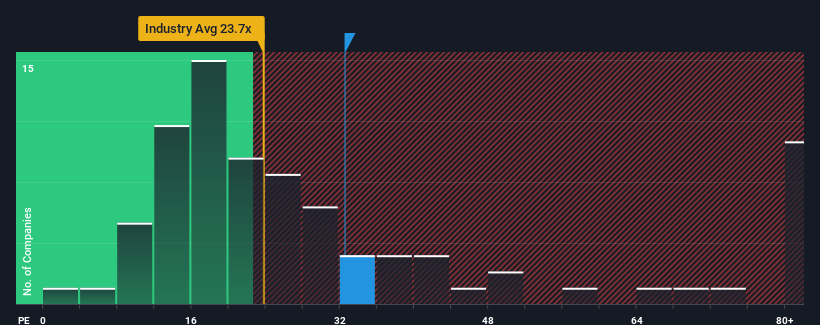
Although its price has surged higher, it's still not a stretch to say that Kuangda Technology Group's price-to-earnings (or "P/E") ratio of 32.5x right now seems quite "middle-of-the-road" compared to the market in China, where the median P/E ratio is around 30x. Although, it's not wise to simply ignore the P/E without explanation as investors may be disregarding a distinct opportunity or a costly mistake.
For instance, Kuangda Technology Group's receding earnings in recent times would have to be some food for thought. One possibility is that the P/E is moderate because investors think the company might still do enough to be in line with the broader market in the near future. If not, then existing shareholders may be a little nervous about the viability of the share price.
View our latest analysis for Kuangda Technology Group
Is There Some Growth For Kuangda Technology Group?
There's an inherent assumption that a company should be matching the market for P/E ratios like Kuangda Technology Group's to be considered reasonable.
Retrospectively, the last year delivered a frustrating 5.4% decrease to the company's bottom line. That put a dampener on the good run it was having over the longer-term as its three-year EPS growth is still a noteworthy 7.8% in total. So we can start by confirming that the company has generally done a good job of growing earnings over that time, even though it had some hiccups along the way.
Weighing that recent medium-term earnings trajectory against the broader market's one-year forecast for expansion of 41% shows it's noticeably less attractive on an annualised basis.
In light of this, it's curious that Kuangda Technology Group's P/E sits in line with the majority of other companies. Apparently many investors in the company are less bearish than recent times would indicate and aren't willing to let go of their stock right now. They may be setting themselves up for future disappointment if the P/E falls to levels more in line with recent growth rates.
What We Can Learn From Kuangda Technology Group's P/E?
Kuangda Technology Group appears to be back in favour with a solid price jump getting its P/E back in line with most other companies. It's argued the price-to-earnings ratio is an inferior measure of value within certain industries, but it can be a powerful business sentiment indicator.
We've established that Kuangda Technology Group currently trades on a higher than expected P/E since its recent three-year growth is lower than the wider market forecast. Right now we are uncomfortable with the P/E as this earnings performance isn't likely to support a more positive sentiment for long. Unless the recent medium-term conditions improve, it's challenging to accept these prices as being reasonable.
You always need to take note of risks, for example - Kuangda Technology Group has 1 warning sign we think you should be aware of.
If you're unsure about the strength of Kuangda Technology Group's business, why not explore our interactive list of stocks with solid business fundamentals for some other companies you may have missed.
Valuation is complex, but we're here to simplify it.
Discover if Kuangda Technology Group might be undervalued or overvalued with our detailed analysis, featuring fair value estimates, potential risks, dividends, insider trades, and its financial condition.
Access Free AnalysisHave feedback on this article? Concerned about the content? Get in touch with us directly. Alternatively, email editorial-team (at) simplywallst.com.
This article by Simply Wall St is general in nature. We provide commentary based on historical data and analyst forecasts only using an unbiased methodology and our articles are not intended to be financial advice. It does not constitute a recommendation to buy or sell any stock, and does not take account of your objectives, or your financial situation. We aim to bring you long-term focused analysis driven by fundamental data. Note that our analysis may not factor in the latest price-sensitive company announcements or qualitative material. Simply Wall St has no position in any stocks mentioned.
About SZSE:002516
Kuangda Technology Group
Engages in the research, development, manufacture, and sale of interior fabrics and power sectors in China and internationally.
Excellent balance sheet average dividend payer.
Market Insights

Advertisement
Community Narratives
The company that turned a verb into a global necessity and basically runs the modern internet, digital ads, smartphones, maps, and AI.
Fair Value US$300.00|6.3% undervalued
OS
Community Contributor
Flowers Foods Pays A Fair Price For Health
Fair Value US$16.12|26.0% undervalued
NV
Community Contributor
TMX Group will thrive with 33.3% profit margin and enduring market moat
Fair Value CA$49.90|3.7% overvalued
LI
Community Contributor