
Advertisement
Some Shandong Ruyi Woolen Garment Group Co., Ltd. (SZSE:002193) Shareholders Look For Exit As Shares Take 26% Pounding
To the annoyance of some shareholders, Shandong Ruyi Woolen Garment Group Co., Ltd. (SZSE:002193) shares are down a considerable 26% in the last month, which continues a horrid run for the company. The recent drop completes a disastrous twelve months for shareholders, who are sitting on a 54% loss during that time.
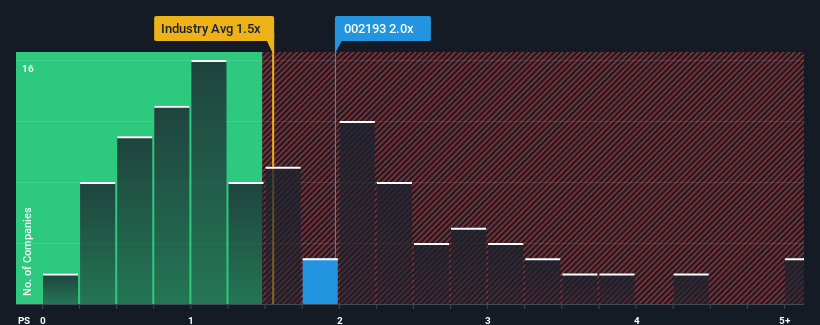
In spite of the heavy fall in price, you could still be forgiven for feeling indifferent about Shandong Ruyi Woolen Garment Group's P/S ratio of 2x, since the median price-to-sales (or "P/S") ratio for the Luxury industry in China is also close to 1.5x. While this might not raise any eyebrows, if the P/S ratio is not justified investors could be missing out on a potential opportunity or ignoring looming disappointment.
View our latest analysis for Shandong Ruyi Woolen Garment Group
What Does Shandong Ruyi Woolen Garment Group's Recent Performance Look Like?
For example, consider that Shandong Ruyi Woolen Garment Group's financial performance has been poor lately as its revenue has been in decline. One possibility is that the P/S is moderate because investors think the company might still do enough to be in line with the broader industry in the near future. If not, then existing shareholders may be a little nervous about the viability of the share price.
Want the full picture on earnings, revenue and cash flow for the company? Then our free report on Shandong Ruyi Woolen Garment Group will help you shine a light on its historical performance.Is There Some Revenue Growth Forecasted For Shandong Ruyi Woolen Garment Group?
In order to justify its P/S ratio, Shandong Ruyi Woolen Garment Group would need to produce growth that's similar to the industry.
Retrospectively, the last year delivered a frustrating 23% decrease to the company's top line. As a result, revenue from three years ago have also fallen 47% overall. Accordingly, shareholders would have felt downbeat about the medium-term rates of revenue growth.
Weighing that medium-term revenue trajectory against the broader industry's one-year forecast for expansion of 16% shows it's an unpleasant look.
In light of this, it's somewhat alarming that Shandong Ruyi Woolen Garment Group's P/S sits in line with the majority of other companies. It seems most investors are ignoring the recent poor growth rate and are hoping for a turnaround in the company's business prospects. There's a good chance existing shareholders are setting themselves up for future disappointment if the P/S falls to levels more in line with the recent negative growth rates.
What Does Shandong Ruyi Woolen Garment Group's P/S Mean For Investors?
Following Shandong Ruyi Woolen Garment Group's share price tumble, its P/S is just clinging on to the industry median P/S. Using the price-to-sales ratio alone to determine if you should sell your stock isn't sensible, however it can be a practical guide to the company's future prospects.
The fact that Shandong Ruyi Woolen Garment Group currently trades at a P/S on par with the rest of the industry is surprising to us since its recent revenues have been in decline over the medium-term, all while the industry is set to grow. Even though it matches the industry, we're uncomfortable with the current P/S ratio, as this dismal revenue performance is unlikely to support a more positive sentiment for long. Unless the the circumstances surrounding the recent medium-term improve, it wouldn't be wrong to expect a a difficult period ahead for the company's shareholders.
Before you settle on your opinion, we've discovered 2 warning signs for Shandong Ruyi Woolen Garment Group (1 is potentially serious!) that you should be aware of.
It's important to make sure you look for a great company, not just the first idea you come across. So if growing profitability aligns with your idea of a great company, take a peek at this free list of interesting companies with strong recent earnings growth (and a low P/E).
New: Manage All Your Stock Portfolios in One Place
We've created the ultimate portfolio companion for stock investors, and it's free.
• Connect an unlimited number of Portfolios and see your total in one currency
• Be alerted to new Warning Signs or Risks via email or mobile
• Track the Fair Value of your stocks
Have feedback on this article? Concerned about the content? Get in touch with us directly. Alternatively, email editorial-team (at) simplywallst.com.
This article by Simply Wall St is general in nature. We provide commentary based on historical data and analyst forecasts only using an unbiased methodology and our articles are not intended to be financial advice. It does not constitute a recommendation to buy or sell any stock, and does not take account of your objectives, or your financial situation. We aim to bring you long-term focused analysis driven by fundamental data. Note that our analysis may not factor in the latest price-sensitive company announcements or qualitative material. Simply Wall St has no position in any stocks mentioned.
About SZSE:002193
Shandong Ruyi Woolen Garment Group
Shandong Ruyi Woolen Garment Group Co., Ltd.
Mediocre balance sheet with minimal risk.
Market Insights

Advertisement
Community Narratives
MicroVision will explode future revenue by 380.37% with a vision towards success
Fair Value US$60.00|98.3% undervalued
TH
Community Contributor
The Indispensable Artery for a New North American Economy
Fair Value CA$132.87|1.0% undervalued
TI
Community Contributor