
Advertisement
Shandong Ruyi Woolen Garment Group Co., Ltd.'s (SZSE:002193) 27% Share Price Surge Not Quite Adding Up
Shandong Ruyi Woolen Garment Group Co., Ltd. (SZSE:002193) shares have continued their recent momentum with a 27% gain in the last month alone. Not all shareholders will be feeling jubilant, since the share price is still down a very disappointing 31% in the last twelve months.
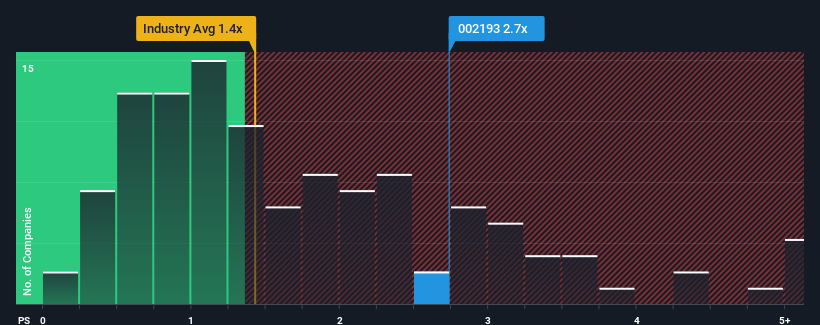
After such a large jump in price, given close to half the companies operating in China's Luxury industry have price-to-sales ratios (or "P/S") below 1.4x, you may consider Shandong Ruyi Woolen Garment Group as a stock to potentially avoid with its 2.7x P/S ratio. Nonetheless, we'd need to dig a little deeper to determine if there is a rational basis for the elevated P/S.
See our latest analysis for Shandong Ruyi Woolen Garment Group
What Does Shandong Ruyi Woolen Garment Group's P/S Mean For Shareholders?
It looks like revenue growth has deserted Shandong Ruyi Woolen Garment Group recently, which is not something to boast about. One possibility is that the P/S is high because investors think the benign revenue growth will improve to outperform the broader industry in the near future. However, if this isn't the case, investors might get caught out paying too much for the stock.
Although there are no analyst estimates available for Shandong Ruyi Woolen Garment Group, take a look at this free data-rich visualisation to see how the company stacks up on earnings, revenue and cash flow.Is There Enough Revenue Growth Forecasted For Shandong Ruyi Woolen Garment Group?
The only time you'd be truly comfortable seeing a P/S as high as Shandong Ruyi Woolen Garment Group's is when the company's growth is on track to outshine the industry.
Taking a look back first, we see that there was hardly any revenue growth to speak of for the company over the past year. Whilst it's an improvement, it wasn't enough to get the company out of the hole it was in, with revenue down 41% overall from three years ago. Accordingly, shareholders would have felt downbeat about the medium-term rates of revenue growth.
Weighing that medium-term revenue trajectory against the broader industry's one-year forecast for expansion of 14% shows it's an unpleasant look.
In light of this, it's alarming that Shandong Ruyi Woolen Garment Group's P/S sits above the majority of other companies. Apparently many investors in the company are way more bullish than recent times would indicate and aren't willing to let go of their stock at any price. Only the boldest would assume these prices are sustainable as a continuation of recent revenue trends is likely to weigh heavily on the share price eventually.
The Final Word
Shandong Ruyi Woolen Garment Group shares have taken a big step in a northerly direction, but its P/S is elevated as a result. Using the price-to-sales ratio alone to determine if you should sell your stock isn't sensible, however it can be a practical guide to the company's future prospects.
We've established that Shandong Ruyi Woolen Garment Group currently trades on a much higher than expected P/S since its recent revenues have been in decline over the medium-term. When we see revenue heading backwards and underperforming the industry forecasts, we feel the possibility of the share price declining is very real, bringing the P/S back into the realm of reasonability. If recent medium-term revenue trends continue, it will place shareholders' investments at significant risk and potential investors in danger of paying an excessive premium.
It is also worth noting that we have found 2 warning signs for Shandong Ruyi Woolen Garment Group (1 is significant!) that you need to take into consideration.
Of course, profitable companies with a history of great earnings growth are generally safer bets. So you may wish to see this free collection of other companies that have reasonable P/E ratios and have grown earnings strongly.
New: Manage All Your Stock Portfolios in One Place
We've created the ultimate portfolio companion for stock investors, and it's free.
• Connect an unlimited number of Portfolios and see your total in one currency
• Be alerted to new Warning Signs or Risks via email or mobile
• Track the Fair Value of your stocks
Have feedback on this article? Concerned about the content? Get in touch with us directly. Alternatively, email editorial-team (at) simplywallst.com.
This article by Simply Wall St is general in nature. We provide commentary based on historical data and analyst forecasts only using an unbiased methodology and our articles are not intended to be financial advice. It does not constitute a recommendation to buy or sell any stock, and does not take account of your objectives, or your financial situation. We aim to bring you long-term focused analysis driven by fundamental data. Note that our analysis may not factor in the latest price-sensitive company announcements or qualitative material. Simply Wall St has no position in any stocks mentioned.
About SZSE:002193
Shandong Ruyi Woolen Garment Group
Shandong Ruyi Woolen Garment Group Co., Ltd.
Mediocre balance sheet with minimal risk.
Market Insights

Advertisement
Community Narratives
MicroVision will explode future revenue by 380.37% with a vision towards success
Fair Value US$60.00|98.3% undervalued
TH
Community Contributor
The Indispensable Artery for a New North American Economy
Fair Value CA$132.87|1.0% undervalued
TI
Community Contributor