
Advertisement
- China
- /
- Consumer Durables
- /
- SZSE:001211
It's A Story Of Risk Vs Reward With Suncha Technology Co., Ltd. (SZSE:001211)
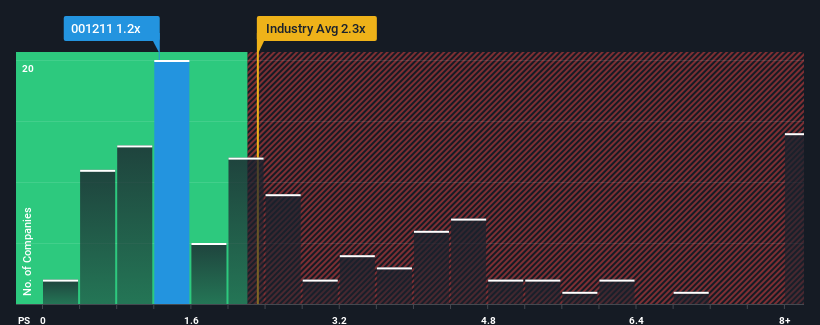
Suncha Technology Co., Ltd.'s (SZSE:001211) price-to-sales (or "P/S") ratio of 1.2x might make it look like a buy right now compared to the Consumer Durables industry in China, where around half of the companies have P/S ratios above 2.3x and even P/S above 5x are quite common. However, the P/S might be low for a reason and it requires further investigation to determine if it's justified.
View our latest analysis for Suncha Technology
What Does Suncha Technology's P/S Mean For Shareholders?
Revenue has risen firmly for Suncha Technology recently, which is pleasing to see. It might be that many expect the respectable revenue performance to degrade substantially, which has repressed the P/S. Those who are bullish on Suncha Technology will be hoping that this isn't the case, so that they can pick up the stock at a lower valuation.
We don't have analyst forecasts, but you can see how recent trends are setting up the company for the future by checking out our free report on Suncha Technology's earnings, revenue and cash flow.Is There Any Revenue Growth Forecasted For Suncha Technology?
There's an inherent assumption that a company should underperform the industry for P/S ratios like Suncha Technology's to be considered reasonable.
Taking a look back first, we see that the company grew revenue by an impressive 25% last year. Pleasingly, revenue has also lifted 34% in aggregate from three years ago, thanks to the last 12 months of growth. Therefore, it's fair to say the revenue growth recently has been superb for the company.
Weighing that recent medium-term revenue trajectory against the broader industry's one-year forecast for expansion of 11% shows it's about the same on an annualised basis.
With this information, we find it odd that Suncha Technology is trading at a P/S lower than the industry. Apparently some shareholders are more bearish than recent times would indicate and have been accepting lower selling prices.
The Final Word
We'd say the price-to-sales ratio's power isn't primarily as a valuation instrument but rather to gauge current investor sentiment and future expectations.
Our examination of Suncha Technology revealed its three-year revenue trends looking similar to current industry expectations hasn't given the P/S the boost we expected, given that it's lower than the wider industry P/S, When we see industry-like revenue growth but a lower than expected P/S, we assume potential risks are what might be placing downward pressure on the share price. revenue trends suggest that the risk of a price decline is low, investors appear to perceive a possibility of revenue volatility in the future.
Having said that, be aware Suncha Technology is showing 3 warning signs in our investment analysis, and 2 of those are significant.
If you're unsure about the strength of Suncha Technology's business, why not explore our interactive list of stocks with solid business fundamentals for some other companies you may have missed.
New: Manage All Your Stock Portfolios in One Place
We've created the ultimate portfolio companion for stock investors, and it's free.
• Connect an unlimited number of Portfolios and see your total in one currency
• Be alerted to new Warning Signs or Risks via email or mobile
• Track the Fair Value of your stocks
Have feedback on this article? Concerned about the content? Get in touch with us directly. Alternatively, email editorial-team (at) simplywallst.com.
This article by Simply Wall St is general in nature. We provide commentary based on historical data and analyst forecasts only using an unbiased methodology and our articles are not intended to be financial advice. It does not constitute a recommendation to buy or sell any stock, and does not take account of your objectives, or your financial situation. We aim to bring you long-term focused analysis driven by fundamental data. Note that our analysis may not factor in the latest price-sensitive company announcements or qualitative material. Simply Wall St has no position in any stocks mentioned.
About SZSE:001211
Suncha Technology
Engages in the research and development, production, and sale of daily kitchen utensils in China.
Slight risk with acceptable track record.
Market Insights

Advertisement
Community Narratives
MicroVision will explode future revenue by 380.37% with a vision towards success
Fair Value US$60.00|98.4% undervalued
TH
Community Contributor
The Indispensable Artery for a New North American Economy
Fair Value CA$132.87|1.3% undervalued
TI
Community Contributor