
Advertisement
- China
- /
- Professional Services
- /
- SZSE:300826
Risks To Shareholder Returns Are Elevated At These Prices For NanJing Research Institute of Surveying, Mapping & Geotechnical Investigation, Co.Ltd (SZSE:300826)
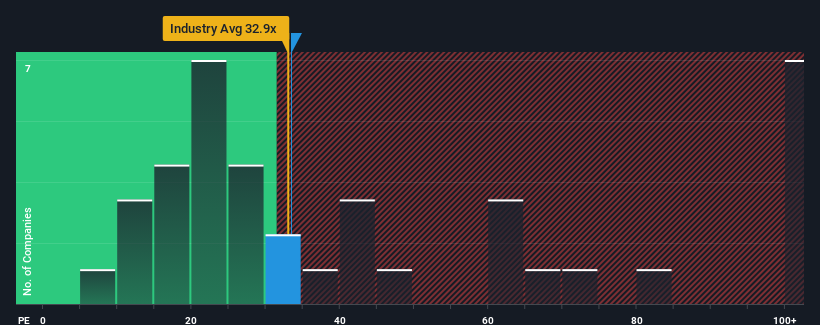
With a price-to-earnings (or "P/E") ratio of 33.4x NanJing Research Institute of Surveying, Mapping & Geotechnical Investigation, Co.Ltd (SZSE:300826) may be sending bearish signals at the moment, given that almost half of all companies in China have P/E ratios under 29x and even P/E's lower than 18x are not unusual. Although, it's not wise to just take the P/E at face value as there may be an explanation why it's as high as it is.
For instance, NanJing Research Institute of Surveying Mapping & Geotechnical InvestigationLtd's receding earnings in recent times would have to be some food for thought. It might be that many expect the company to still outplay most other companies over the coming period, which has kept the P/E from collapsing. If not, then existing shareholders may be quite nervous about the viability of the share price.
How Is NanJing Research Institute of Surveying Mapping & Geotechnical InvestigationLtd's Growth Trending?
In order to justify its P/E ratio, NanJing Research Institute of Surveying Mapping & Geotechnical InvestigationLtd would need to produce impressive growth in excess of the market.
Retrospectively, the last year delivered a frustrating 13% decrease to the company's bottom line. The last three years don't look nice either as the company has shrunk EPS by 40% in aggregate. Therefore, it's fair to say the earnings growth recently has been undesirable for the company.
Weighing that medium-term earnings trajectory against the broader market's one-year forecast for expansion of 41% shows it's an unpleasant look.
With this information, we find it concerning that NanJing Research Institute of Surveying Mapping & Geotechnical InvestigationLtd is trading at a P/E higher than the market. Apparently many investors in the company are way more bullish than recent times would indicate and aren't willing to let go of their stock at any price. There's a very good chance existing shareholders are setting themselves up for future disappointment if the P/E falls to levels more in line with the recent negative growth rates.
The Final Word
While the price-to-earnings ratio shouldn't be the defining factor in whether you buy a stock or not, it's quite a capable barometer of earnings expectations.
We've established that NanJing Research Institute of Surveying Mapping & Geotechnical InvestigationLtd currently trades on a much higher than expected P/E since its recent earnings have been in decline over the medium-term. Right now we are increasingly uncomfortable with the high P/E as this earnings performance is highly unlikely to support such positive sentiment for long. Unless the recent medium-term conditions improve markedly, it's very challenging to accept these prices as being reasonable.
We don't want to rain on the parade too much, but we did also find 4 warning signs for NanJing Research Institute of Surveying Mapping & Geotechnical InvestigationLtd (1 is a bit concerning!) that you need to be mindful of.
Of course, you might find a fantastic investment by looking at a few good candidates. So take a peek at this free list of companies with a strong growth track record, trading on a low P/E.
Valuation is complex, but we're here to simplify it.
Discover if NanJing Research Institute of Surveying Mapping & Geotechnical InvestigationCo.Ltd might be undervalued or overvalued with our detailed analysis, featuring fair value estimates, potential risks, dividends, insider trades, and its financial condition.
Access Free AnalysisHave feedback on this article? Concerned about the content? Get in touch with us directly. Alternatively, email editorial-team (at) simplywallst.com.
This article by Simply Wall St is general in nature. We provide commentary based on historical data and analyst forecasts only using an unbiased methodology and our articles are not intended to be financial advice. It does not constitute a recommendation to buy or sell any stock, and does not take account of your objectives, or your financial situation. We aim to bring you long-term focused analysis driven by fundamental data. Note that our analysis may not factor in the latest price-sensitive company announcements or qualitative material. Simply Wall St has no position in any stocks mentioned.
About SZSE:300826
NanJing Research Institute of Surveying Mapping & Geotechnical InvestigationCo.Ltd
NanJing Research Institute of Surveying, Mapping & Geotechnical Investigation,Co.Ltd.
Adequate balance sheet with low risk.
Market Insights

Advertisement
Community Narratives
The company that turned a verb into a global necessity and basically runs the modern internet, digital ads, smartphones, maps, and AI.
Fair Value US$300.00|6.3% undervalued
OS
Community Contributor
Flowers Foods Pays A Fair Price For Health
Fair Value US$16.12|26.0% undervalued
NV
Community Contributor
TMX Group will thrive with 33.3% profit margin and enduring market moat
Fair Value CA$49.90|3.7% overvalued
LI
Community Contributor