
Advertisement
- China
- /
- Commercial Services
- /
- SZSE:000695
Tianjin Binhai Energy & Development Co.,Ltd (SZSE:000695) Stock Rockets 29% As Investors Are Less Pessimistic Than Expected
Tianjin Binhai Energy & Development Co.,Ltd (SZSE:000695) shareholders are no doubt pleased to see that the share price has bounced 29% in the last month, although it is still struggling to make up recently lost ground. The last 30 days bring the annual gain to a very sharp 45%.
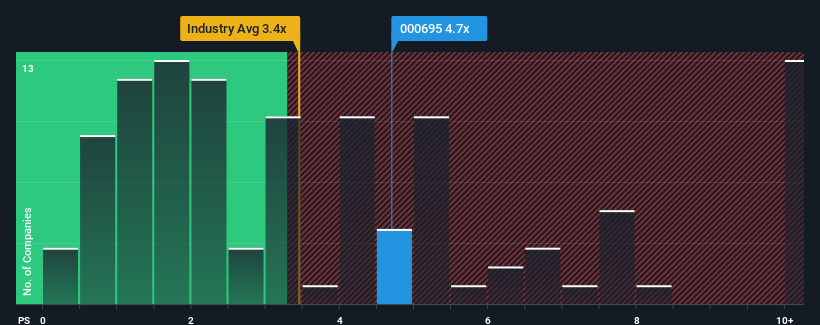
Following the firm bounce in price, you could be forgiven for thinking Tianjin Binhai Energy & DevelopmentLtd is a stock not worth researching with a price-to-sales ratios (or "P/S") of 4.7x, considering almost half the companies in China's Commercial Services industry have P/S ratios below 3.4x. However, the P/S might be high for a reason and it requires further investigation to determine if it's justified.
View our latest analysis for Tianjin Binhai Energy & DevelopmentLtd
What Does Tianjin Binhai Energy & DevelopmentLtd's P/S Mean For Shareholders?
Recent times have been quite advantageous for Tianjin Binhai Energy & DevelopmentLtd as its revenue has been rising very briskly. It seems that many are expecting the strong revenue performance to beat most other companies over the coming period, which has increased investors’ willingness to pay up for the stock. However, if this isn't the case, investors might get caught out paying too much for the stock.
Although there are no analyst estimates available for Tianjin Binhai Energy & DevelopmentLtd, take a look at this free data-rich visualisation to see how the company stacks up on earnings, revenue and cash flow.Do Revenue Forecasts Match The High P/S Ratio?
In order to justify its P/S ratio, Tianjin Binhai Energy & DevelopmentLtd would need to produce impressive growth in excess of the industry.
If we review the last year of revenue growth, the company posted a terrific increase of 129%. Still, revenue has fallen 10% in total from three years ago, which is quite disappointing. Therefore, it's fair to say the revenue growth recently has been undesirable for the company.
Comparing that to the industry, which is predicted to deliver 31% growth in the next 12 months, the company's downward momentum based on recent medium-term revenue results is a sobering picture.
In light of this, it's alarming that Tianjin Binhai Energy & DevelopmentLtd's P/S sits above the majority of other companies. Apparently many investors in the company are way more bullish than recent times would indicate and aren't willing to let go of their stock at any price. Only the boldest would assume these prices are sustainable as a continuation of recent revenue trends is likely to weigh heavily on the share price eventually.
The Final Word
The large bounce in Tianjin Binhai Energy & DevelopmentLtd's shares has lifted the company's P/S handsomely. Using the price-to-sales ratio alone to determine if you should sell your stock isn't sensible, however it can be a practical guide to the company's future prospects.
Our examination of Tianjin Binhai Energy & DevelopmentLtd revealed its shrinking revenue over the medium-term isn't resulting in a P/S as low as we expected, given the industry is set to grow. When we see revenue heading backwards and underperforming the industry forecasts, we feel the possibility of the share price declining is very real, bringing the P/S back into the realm of reasonability. If recent medium-term revenue trends continue, it will place shareholders' investments at significant risk and potential investors in danger of paying an excessive premium.
You always need to take note of risks, for example - Tianjin Binhai Energy & DevelopmentLtd has 2 warning signs we think you should be aware of.
If companies with solid past earnings growth is up your alley, you may wish to see this free collection of other companies with strong earnings growth and low P/E ratios.
Valuation is complex, but we're here to simplify it.
Discover if Tianjin Binhai Energy & DevelopmentLtd might be undervalued or overvalued with our detailed analysis, featuring fair value estimates, potential risks, dividends, insider trades, and its financial condition.
Access Free AnalysisHave feedback on this article? Concerned about the content? Get in touch with us directly. Alternatively, email editorial-team (at) simplywallst.com.
This article by Simply Wall St is general in nature. We provide commentary based on historical data and analyst forecasts only using an unbiased methodology and our articles are not intended to be financial advice. It does not constitute a recommendation to buy or sell any stock, and does not take account of your objectives, or your financial situation. We aim to bring you long-term focused analysis driven by fundamental data. Note that our analysis may not factor in the latest price-sensitive company announcements or qualitative material. Simply Wall St has no position in any stocks mentioned.
About SZSE:000695
Tianjin Binhai Energy & DevelopmentLtd
Engages in the research and development, production and sales of lithium battery negative electrode materials.
Mediocre balance sheet with very low risk.
Market Insights

Advertisement
Community Narratives
MicroVision will explode future revenue by 380.37% with a vision towards success
Fair Value US$60.00|98.3% undervalued
TH
Community Contributor
The Indispensable Artery for a New North American Economy
Fair Value CA$132.87|1.0% undervalued
TI
Community Contributor