- China
- /
- Commercial Services
- /
- SHSE:603661
Investors more bullish on Henglin Home FurnishingsLtd (SHSE:603661) this week as stock swells 13%, despite earnings trending downwards over past five years

It hasn't been the best quarter for Henglin Home Furnishings Co.,Ltd (SHSE:603661) shareholders, since the share price has fallen 21% in that time. But that doesn't change the fact that the returns over the last five years have been pleasing. Its return of 34% has certainly bested the market return!
On the back of a solid 7-day performance, let's check what role the company's fundamentals have played in driving long term shareholder returns.
Check out our latest analysis for Henglin Home FurnishingsLtd
There is no denying that markets are sometimes efficient, but prices do not always reflect underlying business performance. One way to examine how market sentiment has changed over time is to look at the interaction between a company's share price and its earnings per share (EPS).
During five years of share price growth, Henglin Home FurnishingsLtd actually saw its EPS drop 1.2% per year.
So it's hard to argue that the earnings per share are the best metric to judge the company, as it may not be optimized for profits at this point. Therefore, it's worth taking a look at other metrics to try to understand the share price movements.
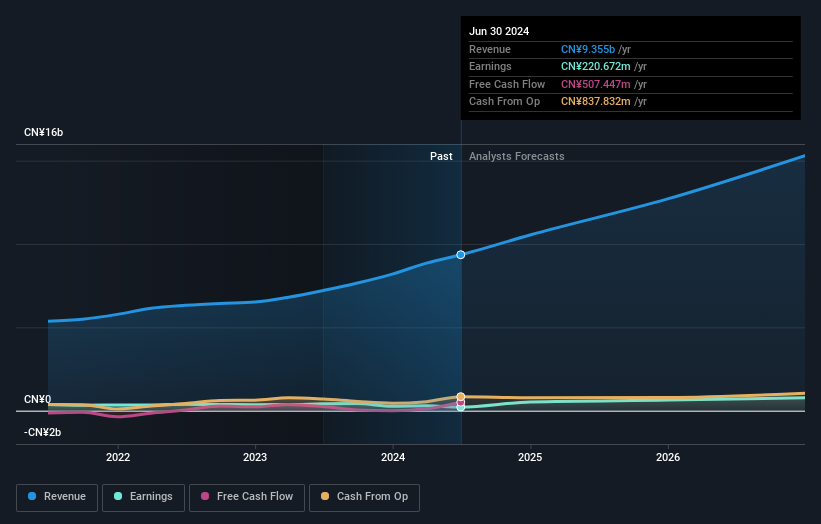
In contrast revenue growth of 23% per year is probably viewed as evidence that Henglin Home FurnishingsLtd is growing, a real positive. It's quite possible that management are prioritizing revenue growth over EPS growth at the moment.
The image below shows how earnings and revenue have tracked over time (if you click on the image you can see greater detail).
You can see how its balance sheet has strengthened (or weakened) over time in this free interactive graphic.
What About The Total Shareholder Return (TSR)?
We've already covered Henglin Home FurnishingsLtd's share price action, but we should also mention its total shareholder return (TSR). Arguably the TSR is a more complete return calculation because it accounts for the value of dividends (as if they were reinvested), along with the hypothetical value of any discounted capital that have been offered to shareholders. Henglin Home FurnishingsLtd's TSR of 43% for the 5 years exceeded its share price return, because it has paid dividends.
A Different Perspective
While it's never nice to take a loss, Henglin Home FurnishingsLtd shareholders can take comfort that their trailing twelve month loss of 0.9% wasn't as bad as the market loss of around 6.0%. Longer term investors wouldn't be so upset, since they would have made 7%, each year, over five years. In the best case scenario the last year is just a temporary blip on the journey to a brighter future. I find it very interesting to look at share price over the long term as a proxy for business performance. But to truly gain insight, we need to consider other information, too. Take risks, for example - Henglin Home FurnishingsLtd has 2 warning signs we think you should be aware of.
If you would prefer to check out another company -- one with potentially superior financials -- then do not miss this free list of companies that have proven they can grow earnings.
Please note, the market returns quoted in this article reflect the market weighted average returns of stocks that currently trade on Chinese exchanges.
Valuation is complex, but we're here to simplify it.
Discover if Henglin Home FurnishingsLtd might be undervalued or overvalued with our detailed analysis, featuring fair value estimates, potential risks, dividends, insider trades, and its financial condition.
Access Free AnalysisHave feedback on this article? Concerned about the content? Get in touch with us directly. Alternatively, email editorial-team (at) simplywallst.com.
This article by Simply Wall St is general in nature. We provide commentary based on historical data and analyst forecasts only using an unbiased methodology and our articles are not intended to be financial advice. It does not constitute a recommendation to buy or sell any stock, and does not take account of your objectives, or your financial situation. We aim to bring you long-term focused analysis driven by fundamental data. Note that our analysis may not factor in the latest price-sensitive company announcements or qualitative material. Simply Wall St has no position in any stocks mentioned.
About SHSE:603661
Henglin Home FurnishingsLtd
Engages in the research and development, production, and sale of office chairs, sofas, massage chairs, panel furniture, and system office products in China.
Undervalued with excellent balance sheet.

