- China
- /
- Commercial Services
- /
- SHSE:603661
Henglin Home FurnishingsLtd's (SHSE:603661) earnings growth rate lags the 17% CAGR delivered to shareholders

When you buy shares in a company, it's worth keeping in mind the possibility that it could fail, and you could lose your money. But on the bright side, you can make far more than 100% on a really good stock. One great example is Henglin Home Furnishings Co.,Ltd (SHSE:603661) which saw its share price drive 104% higher over five years. On the other hand, the stock price has retraced 7.4% in the last week. But this could be related to the soft market, with stocks selling off around 1.8% in the last week.
Although Henglin Home FurnishingsLtd has shed CN¥517m from its market cap this week, let's take a look at its longer term fundamental trends and see if they've driven returns.
Check out our latest analysis for Henglin Home FurnishingsLtd
While markets are a powerful pricing mechanism, share prices reflect investor sentiment, not just underlying business performance. By comparing earnings per share (EPS) and share price changes over time, we can get a feel for how investor attitudes to a company have morphed over time.
During five years of share price growth, Henglin Home FurnishingsLtd achieved compound earnings per share (EPS) growth of 8.2% per year. This EPS growth is lower than the 15% average annual increase in the share price. This suggests that market participants hold the company in higher regard, these days. And that's hardly shocking given the track record of growth.
The company's earnings per share (over time) is depicted in the image below (click to see the exact numbers).
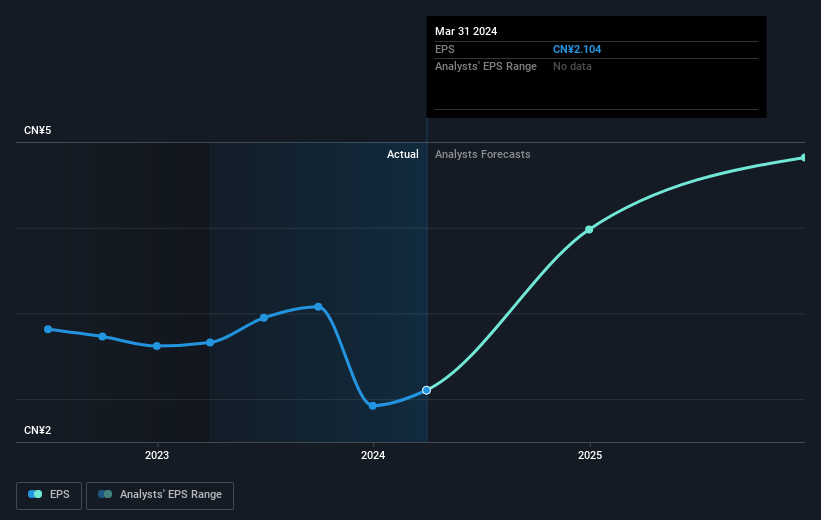
Before buying or selling a stock, we always recommend a close examination of historic growth trends, available here.
What About The Total Shareholder Return (TSR)?
We'd be remiss not to mention the difference between Henglin Home FurnishingsLtd's total shareholder return (TSR) and its share price return. The TSR is a return calculation that accounts for the value of cash dividends (assuming that any dividend received was reinvested) and the calculated value of any discounted capital raisings and spin-offs. Its history of dividend payouts mean that Henglin Home FurnishingsLtd's TSR of 117% over the last 5 years is better than the share price return.
A Different Perspective
We're pleased to report that Henglin Home FurnishingsLtd shareholders have received a total shareholder return of 43% over one year. That's better than the annualised return of 17% over half a decade, implying that the company is doing better recently. Given the share price momentum remains strong, it might be worth taking a closer look at the stock, lest you miss an opportunity. While it is well worth considering the different impacts that market conditions can have on the share price, there are other factors that are even more important. To that end, you should learn about the 2 warning signs we've spotted with Henglin Home FurnishingsLtd (including 1 which makes us a bit uncomfortable) .
For those who like to find winning investments this free list of undervalued companies with recent insider purchasing, could be just the ticket.
Please note, the market returns quoted in this article reflect the market weighted average returns of stocks that currently trade on Chinese exchanges.
Valuation is complex, but we're here to simplify it.
Discover if Henglin Home FurnishingsLtd might be undervalued or overvalued with our detailed analysis, featuring fair value estimates, potential risks, dividends, insider trades, and its financial condition.
Access Free AnalysisHave feedback on this article? Concerned about the content? Get in touch with us directly. Alternatively, email editorial-team (at) simplywallst.com.
This article by Simply Wall St is general in nature. We provide commentary based on historical data and analyst forecasts only using an unbiased methodology and our articles are not intended to be financial advice. It does not constitute a recommendation to buy or sell any stock, and does not take account of your objectives, or your financial situation. We aim to bring you long-term focused analysis driven by fundamental data. Note that our analysis may not factor in the latest price-sensitive company announcements or qualitative material. Simply Wall St has no position in any stocks mentioned.
About SHSE:603661
Henglin Home FurnishingsLtd
Engages in the research and development, production, and sale of office chairs, sofas, massage chairs, panel furniture, and system office products in China.
Undervalued with excellent balance sheet.
