- China
- /
- Commercial Services
- /
- SHSE:603126
Sinoma Energy Conservation's (SHSE:603126) earnings have declined over three years, contributing to shareholders 42% loss

Sinoma Energy Conservation Ltd. (SHSE:603126) shareholders should be happy to see the share price up 21% in the last month. But that doesn't change the fact that the returns over the last three years have been less than pleasing. Truth be told the share price declined 44% in three years and that return, Dear Reader, falls short of what you could have got from passive investing with an index fund.
The recent uptick of 19% could be a positive sign of things to come, so let's take a look at historical fundamentals.
View our latest analysis for Sinoma Energy Conservation
In his essay The Superinvestors of Graham-and-Doddsville Warren Buffett described how share prices do not always rationally reflect the value of a business. One flawed but reasonable way to assess how sentiment around a company has changed is to compare the earnings per share (EPS) with the share price.
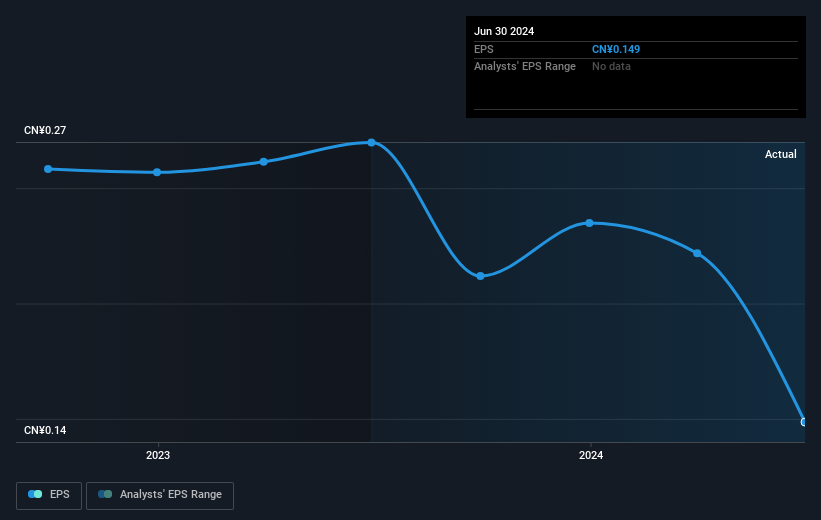
Sinoma Energy Conservation saw its EPS decline at a compound rate of 24% per year, over the last three years. This fall in the EPS is worse than the 18% compound annual share price fall. So the market may not be too worried about the EPS figure, at the moment -- or it may have previously priced some of the drop in.
You can see how EPS has changed over time in the image below (click on the chart to see the exact values).
It's probably worth noting that the CEO is paid less than the median at similar sized companies. It's always worth keeping an eye on CEO pay, but a more important question is whether the company will grow earnings throughout the years. Before buying or selling a stock, we always recommend a close examination of historic growth trends, available here..
What About Dividends?
As well as measuring the share price return, investors should also consider the total shareholder return (TSR). The TSR is a return calculation that accounts for the value of cash dividends (assuming that any dividend received was reinvested) and the calculated value of any discounted capital raisings and spin-offs. Arguably, the TSR gives a more comprehensive picture of the return generated by a stock. As it happens, Sinoma Energy Conservation's TSR for the last 3 years was -42%, which exceeds the share price return mentioned earlier. The dividends paid by the company have thusly boosted the total shareholder return.
A Different Perspective
While the broader market lost about 6.0% in the twelve months, Sinoma Energy Conservation shareholders did even worse, losing 14% (even including dividends). However, it could simply be that the share price has been impacted by broader market jitters. It might be worth keeping an eye on the fundamentals, in case there's a good opportunity. On the bright side, long term shareholders have made money, with a gain of 5% per year over half a decade. If the fundamental data continues to indicate long term sustainable growth, the current sell-off could be an opportunity worth considering. It's always interesting to track share price performance over the longer term. But to understand Sinoma Energy Conservation better, we need to consider many other factors. For example, we've discovered 3 warning signs for Sinoma Energy Conservation that you should be aware of before investing here.
If you like to buy stocks alongside management, then you might just love this free list of companies. (Hint: many of them are unnoticed AND have attractive valuation).
Please note, the market returns quoted in this article reflect the market weighted average returns of stocks that currently trade on Chinese exchanges.
New: Manage All Your Stock Portfolios in One Place
We've created the ultimate portfolio companion for stock investors, and it's free.
• Connect an unlimited number of Portfolios and see your total in one currency
• Be alerted to new Warning Signs or Risks via email or mobile
• Track the Fair Value of your stocks
Have feedback on this article? Concerned about the content? Get in touch with us directly. Alternatively, email editorial-team (at) simplywallst.com.
This article by Simply Wall St is general in nature. We provide commentary based on historical data and analyst forecasts only using an unbiased methodology and our articles are not intended to be financial advice. It does not constitute a recommendation to buy or sell any stock, and does not take account of your objectives, or your financial situation. We aim to bring you long-term focused analysis driven by fundamental data. Note that our analysis may not factor in the latest price-sensitive company announcements or qualitative material. Simply Wall St has no position in any stocks mentioned.
About SHSE:603126
Sinoma Energy Conservation
Provides various products and services in the field of energy conservation and environmental protection in China and internationally.
Excellent balance sheet second-rate dividend payer.

