- China
- /
- Electrical
- /
- SZSE:300786
Why We're Not Concerned Yet About Qingdao Guolin Technology Group Co.,Ltd.'s (SZSE:300786) 38% Share Price Plunge

Qingdao Guolin Technology Group Co.,Ltd. (SZSE:300786) shares have had a horrible month, losing 38% after a relatively good period beforehand. The drop over the last 30 days has capped off a tough year for shareholders, with the share price down 27% in that time.
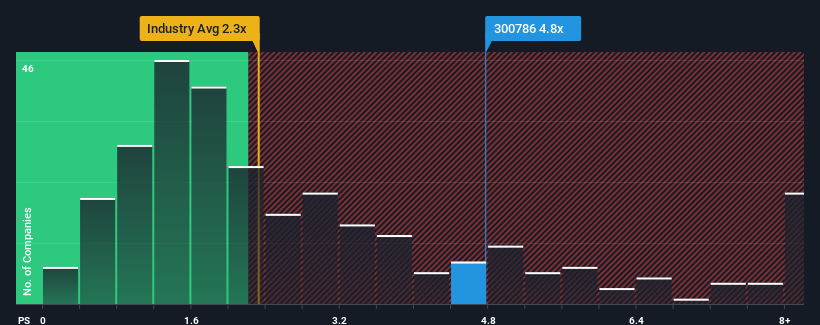
Although its price has dipped substantially, given around half the companies in China's Electrical industry have price-to-sales ratios (or "P/S") below 2.3x, you may still consider Qingdao Guolin Technology GroupLtd as a stock to avoid entirely with its 4.8x P/S ratio. Although, it's not wise to just take the P/S at face value as there may be an explanation why it's so lofty.
Check out our latest analysis for Qingdao Guolin Technology GroupLtd

How Has Qingdao Guolin Technology GroupLtd Performed Recently?
Qingdao Guolin Technology GroupLtd certainly has been doing a good job lately as it's been growing revenue more than most other companies. It seems that many are expecting the strong revenue performance to persist, which has raised the P/S. However, if this isn't the case, investors might get caught out paying too much for the stock.
Keen to find out how analysts think Qingdao Guolin Technology GroupLtd's future stacks up against the industry? In that case, our free report is a great place to start.What Are Revenue Growth Metrics Telling Us About The High P/S?
There's an inherent assumption that a company should far outperform the industry for P/S ratios like Qingdao Guolin Technology GroupLtd's to be considered reasonable.
Taking a look back first, we see that the company grew revenue by an impressive 35% last year. However, this wasn't enough as the latest three year period has seen the company endure a nasty 6.1% drop in revenue in aggregate. Accordingly, shareholders would have felt downbeat about the medium-term rates of revenue growth.
Looking ahead now, revenue is anticipated to climb by 82% during the coming year according to the sole analyst following the company. With the industry only predicted to deliver 25%, the company is positioned for a stronger revenue result.
With this information, we can see why Qingdao Guolin Technology GroupLtd is trading at such a high P/S compared to the industry. Apparently shareholders aren't keen to offload something that is potentially eyeing a more prosperous future.
The Key Takeaway
Even after such a strong price drop, Qingdao Guolin Technology GroupLtd's P/S still exceeds the industry median significantly. Using the price-to-sales ratio alone to determine if you should sell your stock isn't sensible, however it can be a practical guide to the company's future prospects.
We've established that Qingdao Guolin Technology GroupLtd maintains its high P/S on the strength of its forecasted revenue growth being higher than the the rest of the Electrical industry, as expected. At this stage investors feel the potential for a deterioration in revenues is quite remote, justifying the elevated P/S ratio. Unless the analysts have really missed the mark, these strong revenue forecasts should keep the share price buoyant.
And what about other risks? Every company has them, and we've spotted 1 warning sign for Qingdao Guolin Technology GroupLtd you should know about.
If these risks are making you reconsider your opinion on Qingdao Guolin Technology GroupLtd, explore our interactive list of high quality stocks to get an idea of what else is out there.
Valuation is complex, but we're here to simplify it.
Discover if Qingdao Guolin Technology GroupLtd might be undervalued or overvalued with our detailed analysis, featuring fair value estimates, potential risks, dividends, insider trades, and its financial condition.
Access Free AnalysisHave feedback on this article? Concerned about the content? Get in touch with us directly. Alternatively, email editorial-team (at) simplywallst.com.
This article by Simply Wall St is general in nature. We provide commentary based on historical data and analyst forecasts only using an unbiased methodology and our articles are not intended to be financial advice. It does not constitute a recommendation to buy or sell any stock, and does not take account of your objectives, or your financial situation. We aim to bring you long-term focused analysis driven by fundamental data. Note that our analysis may not factor in the latest price-sensitive company announcements or qualitative material. Simply Wall St has no position in any stocks mentioned.
About SZSE:300786
Qingdao Guolin Technology GroupLtd
Engages in the design and manufacture, installation, commissioning, operation, and maintenance of ozone equipment.
Mediocre balance sheet and overvalued.
Market Insights
Community Narratives


