- China
- /
- Electrical
- /
- SZSE:300569
The three-year shareholder returns and company earnings persist lower as Qingdao Tianneng Heavy IndustriesLtd (SZSE:300569) stock falls a further 12% in past week

As an investor its worth striving to ensure your overall portfolio beats the market average. But the risk of stock picking is that you will likely buy under-performing companies. We regret to report that long term Qingdao Tianneng Heavy Industries Co.,Ltd (SZSE:300569) shareholders have had that experience, with the share price dropping 47% in three years, versus a market decline of about 23%. And more recent buyers are having a tough time too, with a drop of 46% in the last year. The falls have accelerated recently, with the share price down 14% in the last three months.
With the stock having lost 12% in the past week, it's worth taking a look at business performance and seeing if there's any red flags.
Check out our latest analysis for Qingdao Tianneng Heavy IndustriesLtd
To quote Buffett, 'Ships will sail around the world but the Flat Earth Society will flourish. There will continue to be wide discrepancies between price and value in the marketplace...' One flawed but reasonable way to assess how sentiment around a company has changed is to compare the earnings per share (EPS) with the share price.
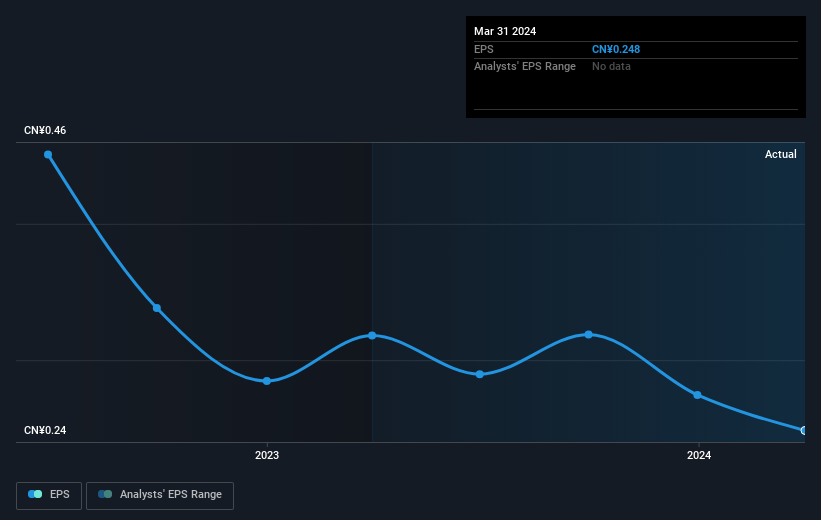
Qingdao Tianneng Heavy IndustriesLtd saw its EPS decline at a compound rate of 31% per year, over the last three years. In comparison the 19% compound annual share price decline isn't as bad as the EPS drop-off. This suggests that the market retains some optimism around long term earnings stability, despite past EPS declines.
You can see below how EPS has changed over time (discover the exact values by clicking on the image).
This free interactive report on Qingdao Tianneng Heavy IndustriesLtd's earnings, revenue and cash flow is a great place to start, if you want to investigate the stock further.
What About Dividends?
When looking at investment returns, it is important to consider the difference between total shareholder return (TSR) and share price return. The TSR incorporates the value of any spin-offs or discounted capital raisings, along with any dividends, based on the assumption that the dividends are reinvested. It's fair to say that the TSR gives a more complete picture for stocks that pay a dividend. As it happens, Qingdao Tianneng Heavy IndustriesLtd's TSR for the last 3 years was -45%, which exceeds the share price return mentioned earlier. This is largely a result of its dividend payments!
A Different Perspective
While the broader market lost about 12% in the twelve months, Qingdao Tianneng Heavy IndustriesLtd shareholders did even worse, losing 46% (even including dividends). Having said that, it's inevitable that some stocks will be oversold in a falling market. The key is to keep your eyes on the fundamental developments. Longer term investors wouldn't be so upset, since they would have made 5%, each year, over five years. If the fundamental data continues to indicate long term sustainable growth, the current sell-off could be an opportunity worth considering. It's always interesting to track share price performance over the longer term. But to understand Qingdao Tianneng Heavy IndustriesLtd better, we need to consider many other factors. For instance, we've identified 3 warning signs for Qingdao Tianneng Heavy IndustriesLtd (1 doesn't sit too well with us) that you should be aware of.
If you are like me, then you will not want to miss this free list of undervalued small caps that insiders are buying.
Please note, the market returns quoted in this article reflect the market weighted average returns of stocks that currently trade on Chinese exchanges.
Valuation is complex, but we're here to simplify it.
Discover if Qingdao Tianneng Heavy IndustriesLtd might be undervalued or overvalued with our detailed analysis, featuring fair value estimates, potential risks, dividends, insider trades, and its financial condition.
Access Free AnalysisHave feedback on this article? Concerned about the content? Get in touch with us directly. Alternatively, email editorial-team (at) simplywallst.com.
This article by Simply Wall St is general in nature. We provide commentary based on historical data and analyst forecasts only using an unbiased methodology and our articles are not intended to be financial advice. It does not constitute a recommendation to buy or sell any stock, and does not take account of your objectives, or your financial situation. We aim to bring you long-term focused analysis driven by fundamental data. Note that our analysis may not factor in the latest price-sensitive company announcements or qualitative material. Simply Wall St has no position in any stocks mentioned.
About SZSE:300569
Qingdao Tianneng Heavy IndustriesLtd
Manufactures and sells wind turbine towers and related equipment in China and internationally.
Slightly overvalued with questionable track record.
