
Advertisement
Be Wary Of Shenzhen JT Automation EquipmentLtd (SZSE:300400) And Its Returns On Capital
To find a multi-bagger stock, what are the underlying trends we should look for in a business? Amongst other things, we'll want to see two things; firstly, a growing return on capital employed (ROCE) and secondly, an expansion in the company's amount of capital employed. If you see this, it typically means it's a company with a great business model and plenty of profitable reinvestment opportunities. Although, when we looked at Shenzhen JT Automation EquipmentLtd (SZSE:300400), it didn't seem to tick all of these boxes.
Understanding Return On Capital Employed (ROCE)
If you haven't worked with ROCE before, it measures the 'return' (pre-tax profit) a company generates from capital employed in its business. Analysts use this formula to calculate it for Shenzhen JT Automation EquipmentLtd:
Return on Capital Employed = Earnings Before Interest and Tax (EBIT) ÷ (Total Assets - Current Liabilities)
0.024 = CN¥21m ÷ (CN¥1.2b - CN¥286m) (Based on the trailing twelve months to March 2024).
Thus, Shenzhen JT Automation EquipmentLtd has an ROCE of 2.4%. Ultimately, that's a low return and it under-performs the Machinery industry average of 5.6%.
See our latest analysis for Shenzhen JT Automation EquipmentLtd
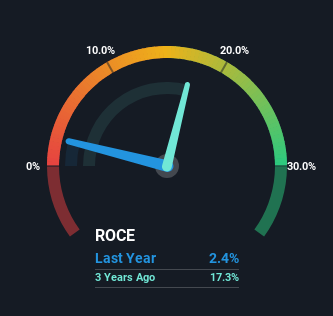
Historical performance is a great place to start when researching a stock so above you can see the gauge for Shenzhen JT Automation EquipmentLtd's ROCE against it's prior returns. If you want to delve into the historical earnings , check out these free graphs detailing revenue and cash flow performance of Shenzhen JT Automation EquipmentLtd.
The Trend Of ROCE
On the surface, the trend of ROCE at Shenzhen JT Automation EquipmentLtd doesn't inspire confidence. Around five years ago the returns on capital were 11%, but since then they've fallen to 2.4%. Given the business is employing more capital while revenue has slipped, this is a bit concerning. This could mean that the business is losing its competitive advantage or market share, because while more money is being put into ventures, it's actually producing a lower return - "less bang for their buck" per se.
What We Can Learn From Shenzhen JT Automation EquipmentLtd's ROCE
From the above analysis, we find it rather worrisome that returns on capital and sales for Shenzhen JT Automation EquipmentLtd have fallen, meanwhile the business is employing more capital than it was five years ago. It should come as no surprise then that the stock has fallen 18% over the last five years, so it looks like investors are recognizing these changes. That being the case, unless the underlying trends revert to a more positive trajectory, we'd consider looking elsewhere.
One final note, you should learn about the 4 warning signs we've spotted with Shenzhen JT Automation EquipmentLtd (including 1 which is a bit unpleasant) .
While Shenzhen JT Automation EquipmentLtd may not currently earn the highest returns, we've compiled a list of companies that currently earn more than 25% return on equity. Check out this free list here.
New: Manage All Your Stock Portfolios in One Place
We've created the ultimate portfolio companion for stock investors, and it's free.
• Connect an unlimited number of Portfolios and see your total in one currency
• Be alerted to new Warning Signs or Risks via email or mobile
• Track the Fair Value of your stocks
Have feedback on this article? Concerned about the content? Get in touch with us directly. Alternatively, email editorial-team (at) simplywallst.com.
This article by Simply Wall St is general in nature. We provide commentary based on historical data and analyst forecasts only using an unbiased methodology and our articles are not intended to be financial advice. It does not constitute a recommendation to buy or sell any stock, and does not take account of your objectives, or your financial situation. We aim to bring you long-term focused analysis driven by fundamental data. Note that our analysis may not factor in the latest price-sensitive company announcements or qualitative material. Simply Wall St has no position in any stocks mentioned.
About SZSE:300400
Shenzhen JT Automation EquipmentLtd
Engages in the research and development, production, and sale of intelligent equipment and manufacturing systems.
Flawless balance sheet with proven track record.
Similar Companies
Market Insights

Advertisement
Community Narratives
MicroVision will explode future revenue by 380.37% with a vision towards success
Fair Value US$60.00|98.4% undervalued
TH
Community Contributor
The Indispensable Artery for a New North American Economy
Fair Value CA$132.87|1.3% undervalued
TI
Community Contributor