Stock Analysis
Some Confidence Is Lacking In Blivex Energy Technology Co., Ltd (SZSE:300116) As Shares Slide 27%


To the annoyance of some shareholders, Blivex Energy Technology Co., Ltd (SZSE:300116) shares are down a considerable 27% in the last month, which continues a horrid run for the company. The drop over the last 30 days has capped off a tough year for shareholders, with the share price down 43% in that time.
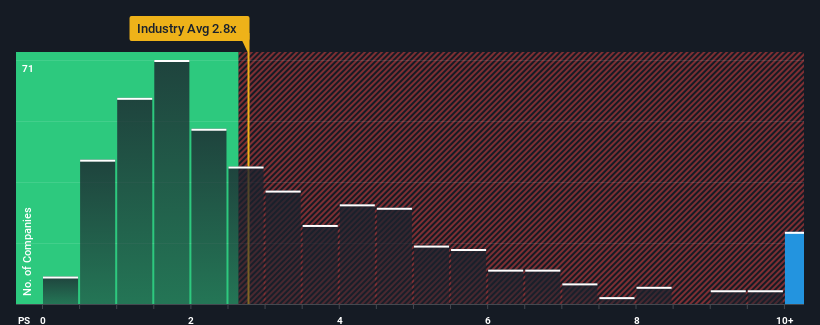
Even after such a large drop in price, when almost half of the companies in China's Machinery industry have price-to-sales ratios (or "P/S") below 2.8x, you may still consider Blivex Energy Technology as a stock not worth researching with its 29x P/S ratio. Although, it's not wise to just take the P/S at face value as there may be an explanation why it's so lofty.
Check out our latest analysis for Blivex Energy Technology
What Does Blivex Energy Technology's P/S Mean For Shareholders?
For instance, Blivex Energy Technology's receding revenue in recent times would have to be some food for thought. Perhaps the market believes the company can do enough to outperform the rest of the industry in the near future, which is keeping the P/S ratio high. If not, then existing shareholders may be quite nervous about the viability of the share price.
Want the full picture on earnings, revenue and cash flow for the company? Then our free report on Blivex Energy Technology will help you shine a light on its historical performance.How Is Blivex Energy Technology's Revenue Growth Trending?
There's an inherent assumption that a company should far outperform the industry for P/S ratios like Blivex Energy Technology's to be considered reasonable.
Retrospectively, the last year delivered a frustrating 27% decrease to the company's top line. This means it has also seen a slide in revenue over the longer-term as revenue is down 2.4% in total over the last three years. So unfortunately, we have to acknowledge that the company has not done a great job of growing revenue over that time.
Comparing that to the industry, which is predicted to deliver 25% growth in the next 12 months, the company's downward momentum based on recent medium-term revenue results is a sobering picture.
In light of this, it's alarming that Blivex Energy Technology's P/S sits above the majority of other companies. It seems most investors are ignoring the recent poor growth rate and are hoping for a turnaround in the company's business prospects. There's a very good chance existing shareholders are setting themselves up for future disappointment if the P/S falls to levels more in line with the recent negative growth rates.
What We Can Learn From Blivex Energy Technology's P/S?
Blivex Energy Technology's shares may have suffered, but its P/S remains high. Using the price-to-sales ratio alone to determine if you should sell your stock isn't sensible, however it can be a practical guide to the company's future prospects.
We've established that Blivex Energy Technology currently trades on a much higher than expected P/S since its recent revenues have been in decline over the medium-term. With a revenue decline on investors' minds, the likelihood of a souring sentiment is quite high which could send the P/S back in line with what we'd expect. If recent medium-term revenue trends continue, it will place shareholders' investments at significant risk and potential investors in danger of paying an excessive premium.
Before you take the next step, you should know about the 1 warning sign for Blivex Energy Technology that we have uncovered.
It's important to make sure you look for a great company, not just the first idea you come across. So if growing profitability aligns with your idea of a great company, take a peek at this free list of interesting companies with strong recent earnings growth (and a low P/E).
Valuation is complex, but we're helping make it simple.
Find out whether Blivex Energy Technology is potentially over or undervalued by checking out our comprehensive analysis, which includes fair value estimates, risks and warnings, dividends, insider transactions and financial health.
View the Free AnalysisHave feedback on this article? Concerned about the content? Get in touch with us directly. Alternatively, email editorial-team (at) simplywallst.com.
This article by Simply Wall St is general in nature. We provide commentary based on historical data and analyst forecasts only using an unbiased methodology and our articles are not intended to be financial advice. It does not constitute a recommendation to buy or sell any stock, and does not take account of your objectives, or your financial situation. We aim to bring you long-term focused analysis driven by fundamental data. Note that our analysis may not factor in the latest price-sensitive company announcements or qualitative material. Simply Wall St has no position in any stocks mentioned.
About SZSE:300116
Blivex Energy Technology
Engages in the development, manufacture, and sale of lithium-ion battery products in the People’s Republic of China.
Mediocre balance sheet with weak fundamentals.
