- China
- /
- Electrical
- /
- SZSE:002518
Shenzhen KSTAR Science and Technology's (SZSE:002518) earnings growth rate lags the 16% CAGR delivered to shareholders


It hasn't been the best quarter for Shenzhen KSTAR Science and Technology Co., Ltd. (SZSE:002518) shareholders, since the share price has fallen 20% in that time. Looking further back, the stock has generated good profits over five years. Its return of 96% has certainly bested the market return! Unfortunately not all shareholders will have held it for the long term, so spare a thought for those caught in the 46% decline over the last twelve months.
Since the long term performance has been good but there's been a recent pullback of 5.4%, let's check if the fundamentals match the share price.
See our latest analysis for Shenzhen KSTAR Science and Technology
To paraphrase Benjamin Graham: Over the short term the market is a voting machine, but over the long term it's a weighing machine. One way to examine how market sentiment has changed over time is to look at the interaction between a company's share price and its earnings per share (EPS).
During five years of share price growth, Shenzhen KSTAR Science and Technology achieved compound earnings per share (EPS) growth of 25% per year. The EPS growth is more impressive than the yearly share price gain of 14% over the same period. Therefore, it seems the market has become relatively pessimistic about the company.
The graphic below depicts how EPS has changed over time (unveil the exact values by clicking on the image).
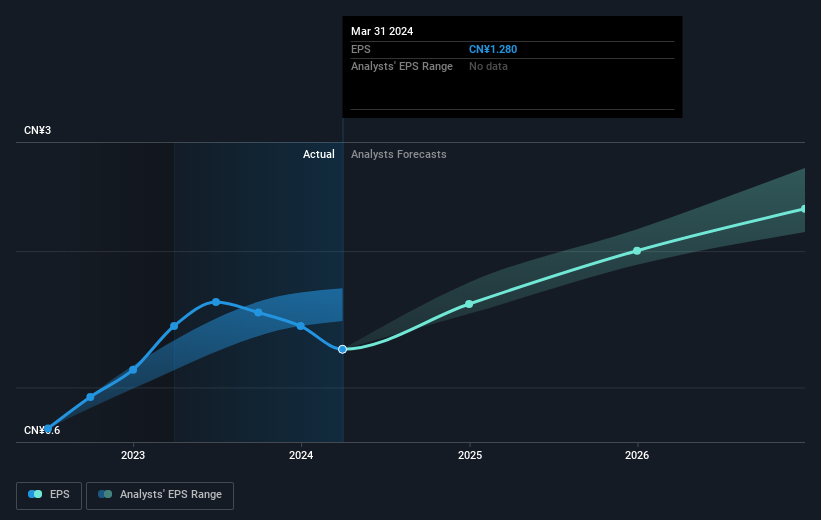
Dive deeper into Shenzhen KSTAR Science and Technology's key metrics by checking this interactive graph of Shenzhen KSTAR Science and Technology's earnings, revenue and cash flow.
What About Dividends?
It is important to consider the total shareholder return, as well as the share price return, for any given stock. The TSR incorporates the value of any spin-offs or discounted capital raisings, along with any dividends, based on the assumption that the dividends are reinvested. It's fair to say that the TSR gives a more complete picture for stocks that pay a dividend. In the case of Shenzhen KSTAR Science and Technology, it has a TSR of 111% for the last 5 years. That exceeds its share price return that we previously mentioned. And there's no prize for guessing that the dividend payments largely explain the divergence!
A Different Perspective
While the broader market lost about 17% in the twelve months, Shenzhen KSTAR Science and Technology shareholders did even worse, losing 45% (even including dividends). Having said that, it's inevitable that some stocks will be oversold in a falling market. The key is to keep your eyes on the fundamental developments. Longer term investors wouldn't be so upset, since they would have made 16%, each year, over five years. If the fundamental data continues to indicate long term sustainable growth, the current sell-off could be an opportunity worth considering. It's always interesting to track share price performance over the longer term. But to understand Shenzhen KSTAR Science and Technology better, we need to consider many other factors. Like risks, for instance. Every company has them, and we've spotted 2 warning signs for Shenzhen KSTAR Science and Technology (of which 1 is concerning!) you should know about.
If you like to buy stocks alongside management, then you might just love this free list of companies. (Hint: many of them are unnoticed AND have attractive valuation).
Please note, the market returns quoted in this article reflect the market weighted average returns of stocks that currently trade on Chinese exchanges.
New: Manage All Your Stock Portfolios in One Place
We've created the ultimate portfolio companion for stock investors, and it's free.
• Connect an unlimited number of Portfolios and see your total in one currency
• Be alerted to new Warning Signs or Risks via email or mobile
• Track the Fair Value of your stocks
Have feedback on this article? Concerned about the content? Get in touch with us directly. Alternatively, email editorial-team (at) simplywallst.com.
This article by Simply Wall St is general in nature. We provide commentary based on historical data and analyst forecasts only using an unbiased methodology and our articles are not intended to be financial advice. It does not constitute a recommendation to buy or sell any stock, and does not take account of your objectives, or your financial situation. We aim to bring you long-term focused analysis driven by fundamental data. Note that our analysis may not factor in the latest price-sensitive company announcements or qualitative material. Simply Wall St has no position in any stocks mentioned.
About SZSE:002518
Shenzhen KSTAR Science and Technology
Shenzhen KSTAR Science and Technology Co., Ltd.
Very undervalued established dividend payer.
