
Advertisement
- China
- /
- Electrical
- /
- SZSE:002518
Does This Valuation Of Shenzhen KSTAR Science and Technology Co., Ltd. (SZSE:002518) Imply Investors Are Overpaying?
Key Insights
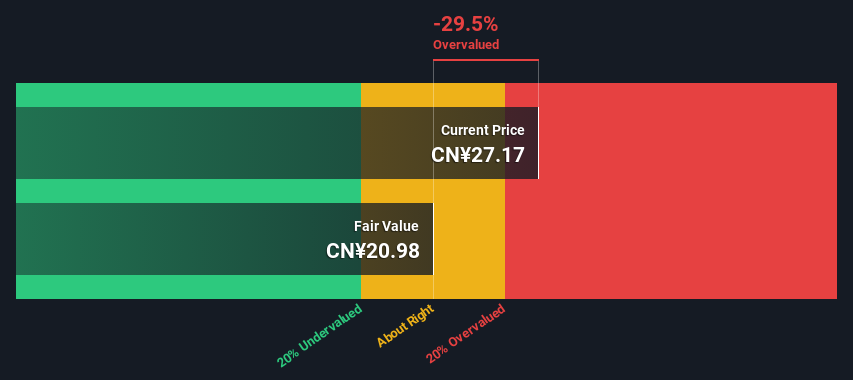
- The projected fair value for Shenzhen KSTAR Science and Technology is CN¥20.98 based on 2 Stage Free Cash Flow to Equity
- Current share price of CN¥27.17 suggests Shenzhen KSTAR Science and Technology is potentially 29% overvalued
- Analyst price target for 002518 is CN¥25.51, which is 22% above our fair value estimate
Does the March share price for Shenzhen KSTAR Science and Technology Co., Ltd. (SZSE:002518) reflect what it's really worth? Today, we will estimate the stock's intrinsic value by estimating the company's future cash flows and discounting them to their present value. One way to achieve this is by employing the Discounted Cash Flow (DCF) model. Don't get put off by the jargon, the math behind it is actually quite straightforward.
We generally believe that a company's value is the present value of all of the cash it will generate in the future. However, a DCF is just one valuation metric among many, and it is not without flaws. If you still have some burning questions about this type of valuation, take a look at the Simply Wall St analysis model.
Crunching The Numbers
We're using the 2-stage growth model, which simply means we take in account two stages of company's growth. In the initial period the company may have a higher growth rate and the second stage is usually assumed to have a stable growth rate. To begin with, we have to get estimates of the next ten years of cash flows. Where possible we use analyst estimates, but when these aren't available we extrapolate the previous free cash flow (FCF) from the last estimate or reported value. We assume companies with shrinking free cash flow will slow their rate of shrinkage, and that companies with growing free cash flow will see their growth rate slow, over this period. We do this to reflect that growth tends to slow more in the early years than it does in later years.
Generally we assume that a dollar today is more valuable than a dollar in the future, so we discount the value of these future cash flows to their estimated value in today's dollars:
10-year free cash flow (FCF) estimate
| 2025 | 2026 | 2027 | 2028 | 2029 | 2030 | 2031 | 2032 | 2033 | 2034 | |
| Levered FCF (CN¥, Millions) | CN¥454.0m | CN¥564.0m | CN¥647.2m | CN¥719.3m | CN¥781.3m | CN¥834.9m | CN¥881.9m | CN¥923.8m | CN¥962.2m | CN¥998.1m |
| Growth Rate Estimate Source | Analyst x1 | Analyst x1 | Est @ 14.75% | Est @ 11.15% | Est @ 8.62% | Est @ 6.86% | Est @ 5.62% | Est @ 4.76% | Est @ 4.15% | Est @ 3.73% |
| Present Value (CN¥, Millions) Discounted @ 8.7% | CN¥418 | CN¥477 | CN¥504 | CN¥515 | CN¥514 | CN¥506 | CN¥491 | CN¥473 | CN¥453 | CN¥433 |
("Est" = FCF growth rate estimated by Simply Wall St)
Present Value of 10-year Cash Flow (PVCF) = CN¥4.8b
The second stage is also known as Terminal Value, this is the business's cash flow after the first stage. For a number of reasons a very conservative growth rate is used that cannot exceed that of a country's GDP growth. In this case we have used the 5-year average of the 10-year government bond yield (2.7%) to estimate future growth. In the same way as with the 10-year 'growth' period, we discount future cash flows to today's value, using a cost of equity of 8.7%.
Terminal Value (TV)= FCF2034 × (1 + g) ÷ (r – g) = CN¥998m× (1 + 2.7%) ÷ (8.7%– 2.7%) = CN¥17b
Present Value of Terminal Value (PVTV)= TV / (1 + r)10= CN¥17b÷ ( 1 + 8.7%)10= CN¥7.4b
The total value, or equity value, is then the sum of the present value of the future cash flows, which in this case is CN¥12b. In the final step we divide the equity value by the number of shares outstanding. Relative to the current share price of CN¥27.2, the company appears slightly overvalued at the time of writing. Remember though, that this is just an approximate valuation, and like any complex formula - garbage in, garbage out.
The Assumptions
The calculation above is very dependent on two assumptions. The first is the discount rate and the other is the cash flows. Part of investing is coming up with your own evaluation of a company's future performance, so try the calculation yourself and check your own assumptions. The DCF also does not consider the possible cyclicality of an industry, or a company's future capital requirements, so it does not give a full picture of a company's potential performance. Given that we are looking at Shenzhen KSTAR Science and Technology as potential shareholders, the cost of equity is used as the discount rate, rather than the cost of capital (or weighted average cost of capital, WACC) which accounts for debt. In this calculation we've used 8.7%, which is based on a levered beta of 1.135. Beta is a measure of a stock's volatility, compared to the market as a whole. We get our beta from the industry average beta of globally comparable companies, with an imposed limit between 0.8 and 2.0, which is a reasonable range for a stable business.
View our latest analysis for Shenzhen KSTAR Science and Technology
SWOT Analysis for Shenzhen KSTAR Science and Technology
Strength
- Debt is well covered by earnings.
Weakness
- Earnings declined over the past year.
- Dividend is low compared to the top 25% of dividend payers in the Electrical market.
- Expensive based on P/E ratio and estimated fair value.
Opportunity
- Annual earnings are forecast to grow faster than the Chinese market.
Threat
- Debt is not well covered by operating cash flow.
- Paying a dividend but company has no free cash flows.
Next Steps:
Whilst important, the DCF calculation ideally won't be the sole piece of analysis you scrutinize for a company. It's not possible to obtain a foolproof valuation with a DCF model. Rather it should be seen as a guide to "what assumptions need to be true for this stock to be under/overvalued?" For example, changes in the company's cost of equity or the risk free rate can significantly impact the valuation. Can we work out why the company is trading at a premium to intrinsic value? For Shenzhen KSTAR Science and Technology, we've compiled three relevant factors you should further research:
- Risks: Case in point, we've spotted 3 warning signs for Shenzhen KSTAR Science and Technology you should be aware of, and 1 of them shouldn't be ignored.
- Future Earnings: How does 002518's growth rate compare to its peers and the wider market? Dig deeper into the analyst consensus number for the upcoming years by interacting with our free analyst growth expectation chart.
- Other Solid Businesses: Low debt, high returns on equity and good past performance are fundamental to a strong business. Why not explore our interactive list of stocks with solid business fundamentals to see if there are other companies you may not have considered!
PS. Simply Wall St updates its DCF calculation for every Chinese stock every day, so if you want to find the intrinsic value of any other stock just search here.
New: Manage All Your Stock Portfolios in One Place
We've created the ultimate portfolio companion for stock investors, and it's free.
• Connect an unlimited number of Portfolios and see your total in one currency
• Be alerted to new Warning Signs or Risks via email or mobile
• Track the Fair Value of your stocks
Have feedback on this article? Concerned about the content? Get in touch with us directly. Alternatively, email editorial-team (at) simplywallst.com.
This article by Simply Wall St is general in nature. We provide commentary based on historical data and analyst forecasts only using an unbiased methodology and our articles are not intended to be financial advice. It does not constitute a recommendation to buy or sell any stock, and does not take account of your objectives, or your financial situation. We aim to bring you long-term focused analysis driven by fundamental data. Note that our analysis may not factor in the latest price-sensitive company announcements or qualitative material. Simply Wall St has no position in any stocks mentioned.
About SZSE:002518
Shenzhen KSTAR Science and Technology
Shenzhen KSTAR Science and Technology Co., Ltd.
Flawless balance sheet with high growth potential and pays a dividend.
Market Insights

Advertisement
Community Narratives
The company that turned a verb into a global necessity and basically runs the modern internet, digital ads, smartphones, maps, and AI.
Fair Value US$300.00|6.2% undervalued
OS
Community Contributor
Flowers Foods Pays A Fair Price For Health
Fair Value US$16.12|25.1% undervalued
NV
Community Contributor
TMX Group will thrive with 33.3% profit margin and enduring market moat
Fair Value CA$49.90|0.04% overvalued
LI
Community Contributor