
Advertisement
Tianjin Saixiang Technology Co.,Ltd's (SZSE:002337) 29% Price Boost Is Out Of Tune With Earnings
Those holding Tianjin Saixiang Technology Co.,Ltd (SZSE:002337) shares would be relieved that the share price has rebounded 29% in the last thirty days, but it needs to keep going to repair the recent damage it has caused to investor portfolios. Longer-term shareholders would be thankful for the recovery in the share price since it's now virtually flat for the year after the recent bounce.
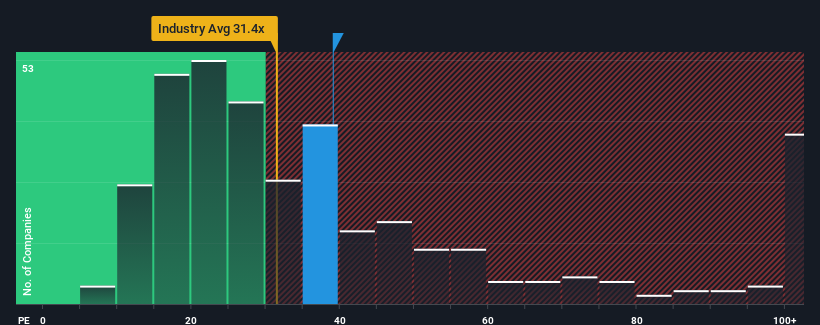
Following the firm bounce in price, Tianjin Saixiang TechnologyLtd may be sending bearish signals at the moment with its price-to-earnings (or "P/E") ratio of 39.1x, since almost half of all companies in China have P/E ratios under 31x and even P/E's lower than 19x are not unusual. Although, it's not wise to just take the P/E at face value as there may be an explanation why it's as high as it is.
Recent times have been quite advantageous for Tianjin Saixiang TechnologyLtd as its earnings have been rising very briskly. It seems that many are expecting the strong earnings performance to beat most other companies over the coming period, which has increased investors’ willingness to pay up for the stock. If not, then existing shareholders might be a little nervous about the viability of the share price.
See our latest analysis for Tianjin Saixiang TechnologyLtd
Does Growth Match The High P/E?
There's an inherent assumption that a company should outperform the market for P/E ratios like Tianjin Saixiang TechnologyLtd's to be considered reasonable.
Taking a look back first, we see that the company grew earnings per share by an impressive 116% last year. Still, EPS has barely risen at all from three years ago in total, which is not ideal. So it appears to us that the company has had a mixed result in terms of growing earnings over that time.
Comparing that to the market, which is predicted to deliver 40% growth in the next 12 months, the company's momentum is weaker based on recent medium-term annualised earnings results.
With this information, we find it concerning that Tianjin Saixiang TechnologyLtd is trading at a P/E higher than the market. Apparently many investors in the company are way more bullish than recent times would indicate and aren't willing to let go of their stock at any price. There's a good chance existing shareholders are setting themselves up for future disappointment if the P/E falls to levels more in line with recent growth rates.
The Key Takeaway
Tianjin Saixiang TechnologyLtd's P/E is getting right up there since its shares have risen strongly. Typically, we'd caution against reading too much into price-to-earnings ratios when settling on investment decisions, though it can reveal plenty about what other market participants think about the company.
Our examination of Tianjin Saixiang TechnologyLtd revealed its three-year earnings trends aren't impacting its high P/E anywhere near as much as we would have predicted, given they look worse than current market expectations. When we see weak earnings with slower than market growth, we suspect the share price is at risk of declining, sending the high P/E lower. Unless the recent medium-term conditions improve markedly, it's very challenging to accept these prices as being reasonable.
Before you take the next step, you should know about the 1 warning sign for Tianjin Saixiang TechnologyLtd that we have uncovered.
If you're unsure about the strength of Tianjin Saixiang TechnologyLtd's business, why not explore our interactive list of stocks with solid business fundamentals for some other companies you may have missed.
Valuation is complex, but we're here to simplify it.
Discover if Tianjin Saixiang TechnologyLtd might be undervalued or overvalued with our detailed analysis, featuring fair value estimates, potential risks, dividends, insider trades, and its financial condition.
Access Free AnalysisHave feedback on this article? Concerned about the content? Get in touch with us directly. Alternatively, email editorial-team (at) simplywallst.com.
This article by Simply Wall St is general in nature. We provide commentary based on historical data and analyst forecasts only using an unbiased methodology and our articles are not intended to be financial advice. It does not constitute a recommendation to buy or sell any stock, and does not take account of your objectives, or your financial situation. We aim to bring you long-term focused analysis driven by fundamental data. Note that our analysis may not factor in the latest price-sensitive company announcements or qualitative material. Simply Wall St has no position in any stocks mentioned.
About SZSE:002337
Tianjin Saixiang TechnologyLtd
Engages in the design, development, manufacture, and sale of radial tire equipment in the People’s Republic of China.
Adequate balance sheet with questionable track record.
Market Insights

Advertisement
Community Narratives
MicroVision will explode future revenue by 380.37% with a vision towards success
Fair Value US$60.00|98.5% undervalued
TH
Community Contributor
The Indispensable Artery for a New North American Economy
Fair Value CA$132.87|2.3% undervalued
TI
Community Contributor