
Advertisement
Getting In Cheap On Shenyang Machine Tool Co., Ltd. (SZSE:000410) Is Unlikely
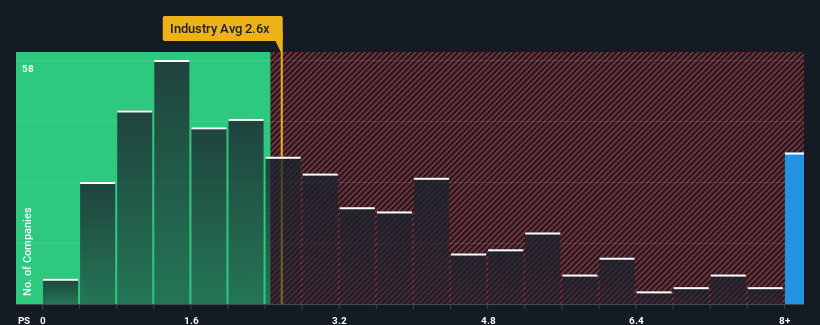
When you see that almost half of the companies in the Machinery industry in China have price-to-sales ratios (or "P/S") below 2.6x, Shenyang Machine Tool Co., Ltd. (SZSE:000410) looks to be giving off strong sell signals with its 9.2x P/S ratio. However, the P/S might be quite high for a reason and it requires further investigation to determine if it's justified.
Check out our latest analysis for Shenyang Machine Tool
What Does Shenyang Machine Tool's P/S Mean For Shareholders?
For example, consider that Shenyang Machine Tool's financial performance has been poor lately as its revenue has been in decline. It might be that many expect the company to still outplay most other companies over the coming period, which has kept the P/S from collapsing. However, if this isn't the case, investors might get caught out paying too much for the stock.
We don't have analyst forecasts, but you can see how recent trends are setting up the company for the future by checking out our free report on Shenyang Machine Tool's earnings, revenue and cash flow.What Are Revenue Growth Metrics Telling Us About The High P/S?
Shenyang Machine Tool's P/S ratio would be typical for a company that's expected to deliver very strong growth, and importantly, perform much better than the industry.
In reviewing the last year of financials, we were disheartened to see the company's revenues fell to the tune of 8.4%. Even so, admirably revenue has lifted 42% in aggregate from three years ago, notwithstanding the last 12 months. Although it's been a bumpy ride, it's still fair to say the revenue growth recently has been more than adequate for the company.
This is in contrast to the rest of the industry, which is expected to grow by 27% over the next year, materially higher than the company's recent medium-term annualised growth rates.
In light of this, it's alarming that Shenyang Machine Tool's P/S sits above the majority of other companies. Apparently many investors in the company are way more bullish than recent times would indicate and aren't willing to let go of their stock at any price. Only the boldest would assume these prices are sustainable as a continuation of recent revenue trends is likely to weigh heavily on the share price eventually.
The Bottom Line On Shenyang Machine Tool's P/S
It's argued the price-to-sales ratio is an inferior measure of value within certain industries, but it can be a powerful business sentiment indicator.
The fact that Shenyang Machine Tool currently trades on a higher P/S relative to the industry is an oddity, since its recent three-year growth is lower than the wider industry forecast. When we observe slower-than-industry revenue growth alongside a high P/S ratio, we assume there to be a significant risk of the share price decreasing, which would result in a lower P/S ratio. Unless the recent medium-term conditions improve markedly, it's very challenging to accept these the share price as being reasonable.
Plus, you should also learn about this 1 warning sign we've spotted with Shenyang Machine Tool.
If companies with solid past earnings growth is up your alley, you may wish to see this free collection of other companies with strong earnings growth and low P/E ratios.
New: Manage All Your Stock Portfolios in One Place
We've created the ultimate portfolio companion for stock investors, and it's free.
• Connect an unlimited number of Portfolios and see your total in one currency
• Be alerted to new Warning Signs or Risks via email or mobile
• Track the Fair Value of your stocks
Have feedback on this article? Concerned about the content? Get in touch with us directly. Alternatively, email editorial-team (at) simplywallst.com.
This article by Simply Wall St is general in nature. We provide commentary based on historical data and analyst forecasts only using an unbiased methodology and our articles are not intended to be financial advice. It does not constitute a recommendation to buy or sell any stock, and does not take account of your objectives, or your financial situation. We aim to bring you long-term focused analysis driven by fundamental data. Note that our analysis may not factor in the latest price-sensitive company announcements or qualitative material. Simply Wall St has no position in any stocks mentioned.
About SZSE:000410
Shenyang Machine Tool
Engages in the mechanical equipment manufacturing business in China and internationally.
Proven track record with adequate balance sheet.
Market Insights

Advertisement
Community Narratives
MicroVision will explode future revenue by 380.37% with a vision towards success
Fair Value US$60.00|98.5% undervalued
TH
Community Contributor
The Indispensable Artery for a New North American Economy
Fair Value CA$132.87|2.3% undervalued
TI
Community Contributor