FULONGMA GROUP Co.,Ltd.'s (SHSE:603686) Financials Are Too Obscure To Link With Current Share Price Momentum: What's In Store For the Stock?


Most readers would already be aware that FULONGMA GROUPLtd's (SHSE:603686) stock increased significantly by 12% over the past week. However, we wonder if the company's inconsistent financials would have any adverse impact on the current share price momentum. Particularly, we will be paying attention to FULONGMA GROUPLtd's ROE today.
Return on Equity or ROE is a test of how effectively a company is growing its value and managing investors’ money. In simpler terms, it measures the profitability of a company in relation to shareholder's equity.
Check out our latest analysis for FULONGMA GROUPLtd
How Do You Calculate Return On Equity?
The formula for return on equity is:
Return on Equity = Net Profit (from continuing operations) ÷ Shareholders' Equity
So, based on the above formula, the ROE for FULONGMA GROUPLtd is:
7.1% = CN¥261m ÷ CN¥3.7b (Based on the trailing twelve months to June 2024).
The 'return' is the yearly profit. One way to conceptualize this is that for each CN¥1 of shareholders' capital it has, the company made CN¥0.07 in profit.
Why Is ROE Important For Earnings Growth?
Thus far, we have learned that ROE measures how efficiently a company is generating its profits. We now need to evaluate how much profit the company reinvests or "retains" for future growth which then gives us an idea about the growth potential of the company. Generally speaking, other things being equal, firms with a high return on equity and profit retention, have a higher growth rate than firms that don’t share these attributes.
FULONGMA GROUPLtd's Earnings Growth And 7.1% ROE
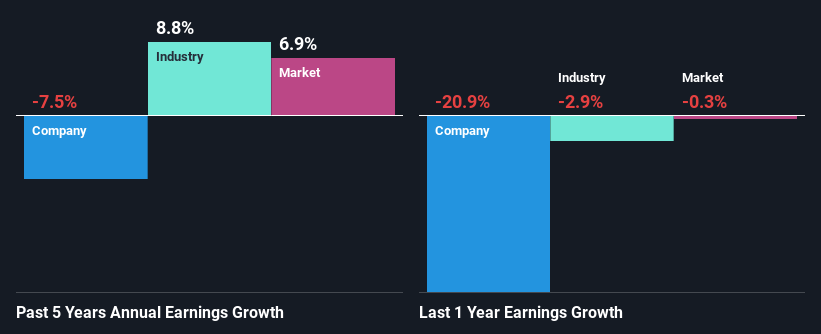
On the face of it, FULONGMA GROUPLtd's ROE is not much to talk about. However, its ROE is similar to the industry average of 7.0%, so we won't completely dismiss the company. But FULONGMA GROUPLtd saw a five year net income decline of 7.5% over the past five years. Remember, the company's ROE is a bit low to begin with. Hence, this goes some way in explaining the shrinking earnings.
That being said, we compared FULONGMA GROUPLtd's performance with the industry and were concerned when we found that while the company has shrunk its earnings, the industry has grown its earnings at a rate of 8.8% in the same 5-year period.
Earnings growth is an important metric to consider when valuing a stock. What investors need to determine next is if the expected earnings growth, or the lack of it, is already built into the share price. Doing so will help them establish if the stock's future looks promising or ominous. Is FULONGMA GROUPLtd fairly valued compared to other companies? These 3 valuation measures might help you decide.
Is FULONGMA GROUPLtd Using Its Retained Earnings Effectively?
In spite of a normal three-year median payout ratio of 40% (that is, a retention ratio of 60%), the fact that FULONGMA GROUPLtd's earnings have shrunk is quite puzzling. It looks like there might be some other reasons to explain the lack in that respect. For example, the business could be in decline.
In addition, FULONGMA GROUPLtd has been paying dividends over a period of nine years suggesting that keeping up dividend payments is preferred by the management even though earnings have been in decline.
Conclusion
Overall, we have mixed feelings about FULONGMA GROUPLtd. Even though it appears to be retaining most of its profits, given the low ROE, investors may not be benefitting from all that reinvestment after all. The low earnings growth suggests our theory correct. With that said, we studied the latest analyst forecasts and found that while the company has shrunk its earnings in the past, analysts expect its earnings to grow in the future. To know more about the company's future earnings growth forecasts take a look at this free report on analyst forecasts for the company to find out more.
New: AI Stock Screener & Alerts
Our new AI Stock Screener scans the market every day to uncover opportunities.
• Dividend Powerhouses (3%+ Yield)
• Undervalued Small Caps with Insider Buying
• High growth Tech and AI Companies
Or build your own from over 50 metrics.
Have feedback on this article? Concerned about the content? Get in touch with us directly. Alternatively, email editorial-team (at) simplywallst.com.
This article by Simply Wall St is general in nature. We provide commentary based on historical data and analyst forecasts only using an unbiased methodology and our articles are not intended to be financial advice. It does not constitute a recommendation to buy or sell any stock, and does not take account of your objectives, or your financial situation. We aim to bring you long-term focused analysis driven by fundamental data. Note that our analysis may not factor in the latest price-sensitive company announcements or qualitative material. Simply Wall St has no position in any stocks mentioned.
About SHSE:603686
Excellent balance sheet with moderate growth potential.

