- China
- /
- Construction
- /
- SHSE:601886
While shareholders of Jangho Group (SHSE:601886) are in the red over the last year, underlying earnings have actually grown


It's easy to match the overall market return by buying an index fund. While individual stocks can be big winners, plenty more fail to generate satisfactory returns. For example, the Jangho Group Co., Ltd. (SHSE:601886) share price is down 39% in the last year. That falls noticeably short of the market decline of around 14%. Even if you look out three years, the returns are still disappointing, with the share price down33% in that time. On the other hand, we note it's up 8.8% in about a month.
While the last year has been tough for Jangho Group shareholders, this past week has shown signs of promise. So let's look at the longer term fundamentals and see if they've been the driver of the negative returns.
Check out our latest analysis for Jangho Group
While the efficient markets hypothesis continues to be taught by some, it has been proven that markets are over-reactive dynamic systems, and investors are not always rational. One imperfect but simple way to consider how the market perception of a company has shifted is to compare the change in the earnings per share (EPS) with the share price movement.
Even though the Jangho Group share price is down over the year, its EPS actually improved. It's quite possible that growth expectations may have been unreasonable in the past.
The divergence between the EPS and the share price is quite notable, during the year. So it's easy to justify a look at some other metrics.
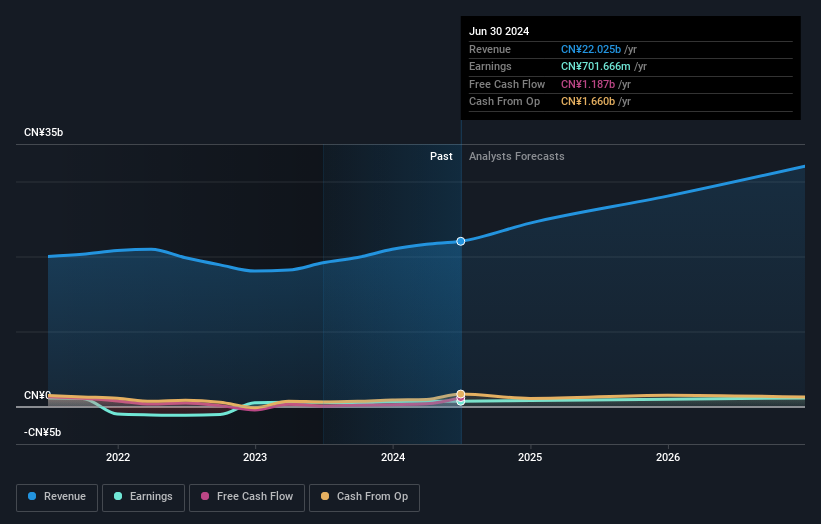
Jangho Group's dividend seems healthy to us, so we doubt that the yield is a concern for the market. The revenue trend doesn't seem to explain why the share price is down. Unless, of course, the market was expecting a revenue uptick.
You can see below how earnings and revenue have changed over time (discover the exact values by clicking on the image).
We know that Jangho Group has improved its bottom line lately, but what does the future have in store? This free report showing analyst forecasts should help you form a view on Jangho Group
What About Dividends?
It is important to consider the total shareholder return, as well as the share price return, for any given stock. The TSR is a return calculation that accounts for the value of cash dividends (assuming that any dividend received was reinvested) and the calculated value of any discounted capital raisings and spin-offs. Arguably, the TSR gives a more comprehensive picture of the return generated by a stock. In the case of Jangho Group, it has a TSR of -37% for the last 1 year. That exceeds its share price return that we previously mentioned. And there's no prize for guessing that the dividend payments largely explain the divergence!
A Different Perspective
We regret to report that Jangho Group shareholders are down 37% for the year (even including dividends). Unfortunately, that's worse than the broader market decline of 14%. Having said that, it's inevitable that some stocks will be oversold in a falling market. The key is to keep your eyes on the fundamental developments. Regrettably, last year's performance caps off a bad run, with the shareholders facing a total loss of 4% per year over five years. Generally speaking long term share price weakness can be a bad sign, though contrarian investors might want to research the stock in hope of a turnaround. I find it very interesting to look at share price over the long term as a proxy for business performance. But to truly gain insight, we need to consider other information, too. Take risks, for example - Jangho Group has 2 warning signs we think you should be aware of.
For those who like to find winning investments this free list of undervalued companies with recent insider purchasing, could be just the ticket.
Please note, the market returns quoted in this article reflect the market weighted average returns of stocks that currently trade on Chinese exchanges.
New: Manage All Your Stock Portfolios in One Place
We've created the ultimate portfolio companion for stock investors, and it's free.
• Connect an unlimited number of Portfolios and see your total in one currency
• Be alerted to new Warning Signs or Risks via email or mobile
• Track the Fair Value of your stocks
Have feedback on this article? Concerned about the content? Get in touch with us directly. Alternatively, email editorial-team (at) simplywallst.com.
This article by Simply Wall St is general in nature. We provide commentary based on historical data and analyst forecasts only using an unbiased methodology and our articles are not intended to be financial advice. It does not constitute a recommendation to buy or sell any stock, and does not take account of your objectives, or your financial situation. We aim to bring you long-term focused analysis driven by fundamental data. Note that our analysis may not factor in the latest price-sensitive company announcements or qualitative material. Simply Wall St has no position in any stocks mentioned.
About SHSE:601886
Jangho Group
Engages in architectural decoration business in Mainland China, Hong Kong, Macau, Taiwan, and internationally.
Flawless balance sheet, undervalued and pays a dividend.
