Stock Analysis
- China
- /
- Construction
- /
- SHSE:600853
Longjian Road&BridgeLtd (SHSE:600853) sheds 9.1% this week, as yearly returns fall more in line with earnings growth


One simple way to benefit from the stock market is to buy an index fund. But if you choose individual stocks with prowess, you can make superior returns. For example, Longjian Road&Bridge Co.,Ltd (SHSE:600853) shareholders have seen the share price rise 39% over three years, well in excess of the market decline (22%, not including dividends).
While the stock has fallen 9.1% this week, it's worth focusing on the longer term and seeing if the stocks historical returns have been driven by the underlying fundamentals.
View our latest analysis for Longjian Road&BridgeLtd
To quote Buffett, 'Ships will sail around the world but the Flat Earth Society will flourish. There will continue to be wide discrepancies between price and value in the marketplace...' One flawed but reasonable way to assess how sentiment around a company has changed is to compare the earnings per share (EPS) with the share price.
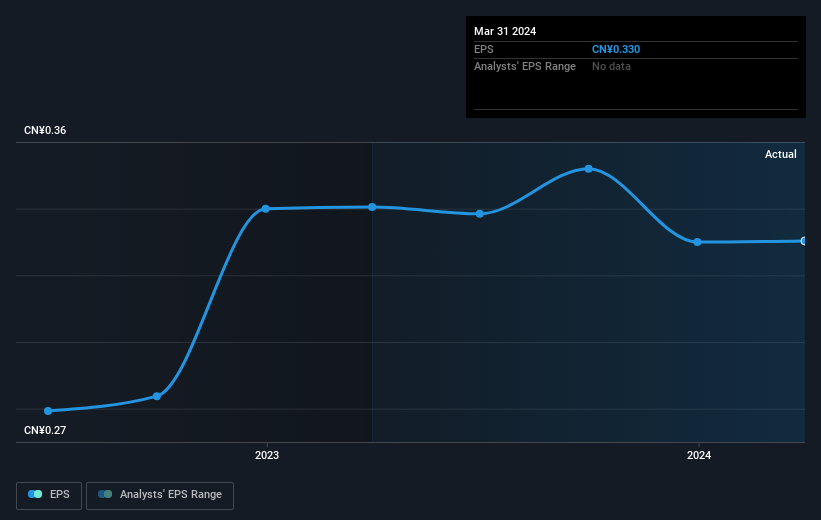
During three years of share price growth, Longjian Road&BridgeLtd achieved compound earnings per share growth of 13% per year. We don't think it is entirely coincidental that the EPS growth is reasonably close to the 12% average annual increase in the share price. This observation indicates that the market's attitude to the business hasn't changed all that much. Rather, the share price has approximately tracked EPS growth.
You can see below how EPS has changed over time (discover the exact values by clicking on the image).
Dive deeper into Longjian Road&BridgeLtd's key metrics by checking this interactive graph of Longjian Road&BridgeLtd's earnings, revenue and cash flow.
What About Dividends?
It is important to consider the total shareholder return, as well as the share price return, for any given stock. Whereas the share price return only reflects the change in the share price, the TSR includes the value of dividends (assuming they were reinvested) and the benefit of any discounted capital raising or spin-off. It's fair to say that the TSR gives a more complete picture for stocks that pay a dividend. As it happens, Longjian Road&BridgeLtd's TSR for the last 3 years was 42%, which exceeds the share price return mentioned earlier. This is largely a result of its dividend payments!
A Different Perspective
We regret to report that Longjian Road&BridgeLtd shareholders are down 24% for the year (even including dividends). Unfortunately, that's worse than the broader market decline of 7.4%. However, it could simply be that the share price has been impacted by broader market jitters. It might be worth keeping an eye on the fundamentals, in case there's a good opportunity. Longer term investors wouldn't be so upset, since they would have made 7%, each year, over five years. It could be that the recent sell-off is an opportunity, so it may be worth checking the fundamental data for signs of a long term growth trend. I find it very interesting to look at share price over the long term as a proxy for business performance. But to truly gain insight, we need to consider other information, too. Take risks, for example - Longjian Road&BridgeLtd has 2 warning signs (and 1 which is concerning) we think you should know about.
Of course Longjian Road&BridgeLtd may not be the best stock to buy. So you may wish to see this free collection of growth stocks.
Please note, the market returns quoted in this article reflect the market weighted average returns of stocks that currently trade on Chinese exchanges.
Valuation is complex, but we're helping make it simple.
Find out whether Longjian Road&BridgeLtd is potentially over or undervalued by checking out our comprehensive analysis, which includes fair value estimates, risks and warnings, dividends, insider transactions and financial health.
View the Free AnalysisHave feedback on this article? Concerned about the content? Get in touch with us directly. Alternatively, email editorial-team (at) simplywallst.com.
This article by Simply Wall St is general in nature. We provide commentary based on historical data and analyst forecasts only using an unbiased methodology and our articles are not intended to be financial advice. It does not constitute a recommendation to buy or sell any stock, and does not take account of your objectives, or your financial situation. We aim to bring you long-term focused analysis driven by fundamental data. Note that our analysis may not factor in the latest price-sensitive company announcements or qualitative material. Simply Wall St has no position in any stocks mentioned.
About SHSE:600853
Longjian Road&BridgeLtd
Engages in the construction of roads and bridges in China and internationally.
Second-rate dividend payer and slightly overvalued.
