- China
- /
- Electrical
- /
- SHSE:600580
Despite lower earnings than five years ago, Wolong Electric GroupLtd (SHSE:600580) investors are up 58% since then


It might be of some concern to shareholders to see the Wolong Electric Group Co.,Ltd. (SHSE:600580) share price down 10% in the last month. But that doesn't change the fact that the returns over the last five years have been pleasing. Its return of 49% has certainly bested the market return!
Although Wolong Electric GroupLtd has shed CN¥744m from its market cap this week, let's take a look at its longer term fundamental trends and see if they've driven returns.
View our latest analysis for Wolong Electric GroupLtd
While markets are a powerful pricing mechanism, share prices reflect investor sentiment, not just underlying business performance. One flawed but reasonable way to assess how sentiment around a company has changed is to compare the earnings per share (EPS) with the share price.
During five years of share price growth, Wolong Electric GroupLtd actually saw its EPS drop 9.2% per year.
Essentially, it doesn't seem likely that investors are focused on EPS. Because earnings per share don't seem to match up with the share price, we'll take a look at other metrics instead.
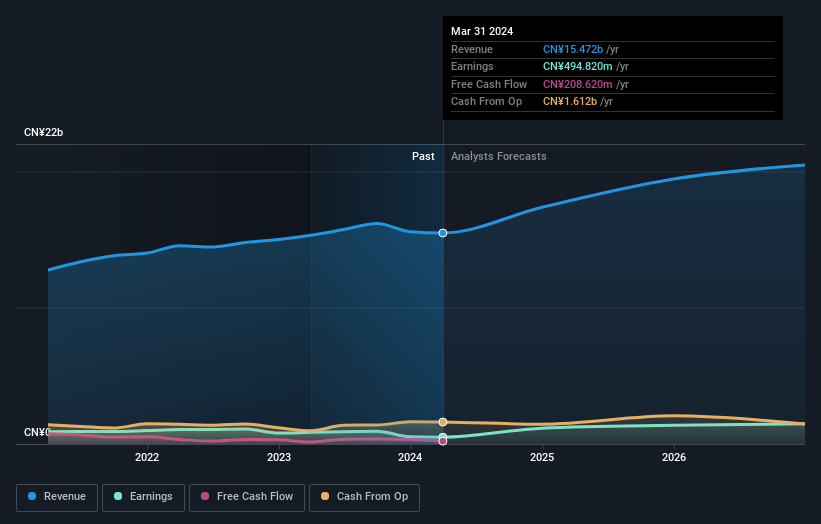
The modest 0.8% dividend yield is unlikely to be propping up the share price. In contrast revenue growth of 6.8% per year is probably viewed as evidence that Wolong Electric GroupLtd is growing, a real positive. In that case, the company may be sacrificing current earnings per share to drive growth.
You can see how earnings and revenue have changed over time in the image below (click on the chart to see the exact values).
You can see how its balance sheet has strengthened (or weakened) over time in this free interactive graphic.
What About Dividends?
As well as measuring the share price return, investors should also consider the total shareholder return (TSR). The TSR incorporates the value of any spin-offs or discounted capital raisings, along with any dividends, based on the assumption that the dividends are reinvested. Arguably, the TSR gives a more comprehensive picture of the return generated by a stock. As it happens, Wolong Electric GroupLtd's TSR for the last 5 years was 58%, which exceeds the share price return mentioned earlier. And there's no prize for guessing that the dividend payments largely explain the divergence!
A Different Perspective
It's good to see that Wolong Electric GroupLtd has rewarded shareholders with a total shareholder return of 11% in the last twelve months. And that does include the dividend. Since the one-year TSR is better than the five-year TSR (the latter coming in at 10% per year), it would seem that the stock's performance has improved in recent times. Given the share price momentum remains strong, it might be worth taking a closer look at the stock, lest you miss an opportunity. While it is well worth considering the different impacts that market conditions can have on the share price, there are other factors that are even more important. For instance, we've identified 3 warning signs for Wolong Electric GroupLtd (1 is a bit unpleasant) that you should be aware of.
Of course Wolong Electric GroupLtd may not be the best stock to buy. So you may wish to see this free collection of growth stocks.
Please note, the market returns quoted in this article reflect the market weighted average returns of stocks that currently trade on Chinese exchanges.
Valuation is complex, but we're here to simplify it.
Discover if Wolong Electric GroupLtd might be undervalued or overvalued with our detailed analysis, featuring fair value estimates, potential risks, dividends, insider trades, and its financial condition.
Access Free AnalysisHave feedback on this article? Concerned about the content? Get in touch with us directly. Alternatively, email editorial-team (at) simplywallst.com.
This article by Simply Wall St is general in nature. We provide commentary based on historical data and analyst forecasts only using an unbiased methodology and our articles are not intended to be financial advice. It does not constitute a recommendation to buy or sell any stock, and does not take account of your objectives, or your financial situation. We aim to bring you long-term focused analysis driven by fundamental data. Note that our analysis may not factor in the latest price-sensitive company announcements or qualitative material. Simply Wall St has no position in any stocks mentioned.
About SHSE:600580
Wolong Electric GroupLtd
Manufactures and sells motors and drives worldwide.
Flawless balance sheet with moderate growth potential.
