
Advertisement
Finding a business that has the potential to grow substantially is not easy, but it is possible if we look at a few key financial metrics. Ideally, a business will show two trends; firstly a growing return on capital employed (ROCE) and secondly, an increasing amount of capital employed. If you see this, it typically means it's a company with a great business model and plenty of profitable reinvestment opportunities. With that in mind, the ROCE of NARI Technology (SHSE:600406) looks decent, right now, so lets see what the trend of returns can tell us.
Understanding Return On Capital Employed (ROCE)
For those who don't know, ROCE is a measure of a company's yearly pre-tax profit (its return), relative to the capital employed in the business. To calculate this metric for NARI Technology, this is the formula:
Return on Capital Employed = Earnings Before Interest and Tax (EBIT) ÷ (Total Assets - Current Liabilities)
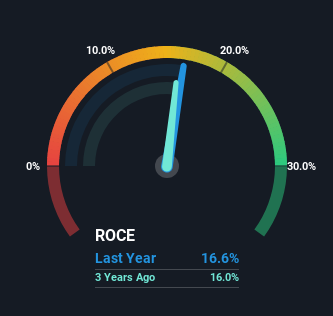
0.17 = CN¥8.3b ÷ (CN¥84b - CN¥34b) (Based on the trailing twelve months to September 2024).
Therefore, NARI Technology has an ROCE of 17%. On its own, that's a standard return, however it's much better than the 5.8% generated by the Electrical industry.
Check out our latest analysis for NARI Technology
In the above chart we have measured NARI Technology's prior ROCE against its prior performance, but the future is arguably more important. If you'd like, you can check out the forecasts from the analysts covering NARI Technology for free.
The Trend Of ROCE
While the current returns on capital are decent, they haven't changed much. Over the past five years, ROCE has remained relatively flat at around 17% and the business has deployed 64% more capital into its operations. 17% is a pretty standard return, and it provides some comfort knowing that NARI Technology has consistently earned this amount. Over long periods of time, returns like these might not be too exciting, but with consistency they can pay off in terms of share price returns.
On a separate but related note, it's important to know that NARI Technology has a current liabilities to total assets ratio of 40%, which we'd consider pretty high. This can bring about some risks because the company is basically operating with a rather large reliance on its suppliers or other sorts of short-term creditors. Ideally we'd like to see this reduce as that would mean fewer obligations bearing risks.
The Bottom Line
The main thing to remember is that NARI Technology has proven its ability to continually reinvest at respectable rates of return. And the stock has done incredibly well with a 120% return over the last five years, so long term investors are no doubt ecstatic with that result. So while the positive underlying trends may be accounted for by investors, we still think this stock is worth looking into further.
On a final note, we've found 1 warning sign for NARI Technology that we think you should be aware of.
While NARI Technology isn't earning the highest return, check out this free list of companies that are earning high returns on equity with solid balance sheets.
Valuation is complex, but we're here to simplify it.
Discover if NARI Technology might be undervalued or overvalued with our detailed analysis, featuring fair value estimates, potential risks, dividends, insider trades, and its financial condition.
Access Free AnalysisHave feedback on this article? Concerned about the content? Get in touch with us directly. Alternatively, email editorial-team (at) simplywallst.com.
This article by Simply Wall St is general in nature. We provide commentary based on historical data and analyst forecasts only using an unbiased methodology and our articles are not intended to be financial advice. It does not constitute a recommendation to buy or sell any stock, and does not take account of your objectives, or your financial situation. We aim to bring you long-term focused analysis driven by fundamental data. Note that our analysis may not factor in the latest price-sensitive company announcements or qualitative material. Simply Wall St has no position in any stocks mentioned.
About SHSE:600406
NARI Technology
Provides power intelligence solutions in China and internationally.
Very undervalued with flawless balance sheet and pays a dividend.
Similar Companies
Market Insights

Advertisement
Community Narratives
MicroVision will explode future revenue by 380.37% with a vision towards success
Fair Value US$60|98.4% undervalued
TH
Community Contributor
The Indispensable Artery for a New North American Economy
Fair Value CA$132.87|3.6% undervalued
TI
Community Contributor
Recently Updated Narratives
TI


TickerTickle on Oracle ·
The Quiet Giant That Became AI’s Power Grid
Fair Value:US$389.8148.6% undervalued
2 followersusers have followed this narrative
0 commentsusers have commented on this narrative
0 likesusers have liked this narrative
AU

AuCA on Nova Ljubljanska Banka d.d ·
Nova Ljubljanska Banka d.d will expect a 11.2% revenue boost driving future growth
Fair Value:€20916.0% undervalued
22 followersusers have followed this narrative
3 commentsusers have commented on this narrative
0 likesusers have liked this narrative
BI


BinocularMan on NVIDIA ·
The AI Infrastructure Giant Grows Into Its Valuation
Fair Value:US$345.0747.1% undervalued
1 followerusers have followed this narrative
0 commentsusers have commented on this narrative
0 likesusers have liked this narrative