
Advertisement
- China
- /
- Auto Components
- /
- SZSE:300643
Further Upside For Hamaton Automotive Technology Co., Ltd (SZSE:300643) Shares Could Introduce Price Risks After 28% Bounce
Hamaton Automotive Technology Co., Ltd (SZSE:300643) shareholders are no doubt pleased to see that the share price has bounced 28% in the last month, although it is still struggling to make up recently lost ground. Not all shareholders will be feeling jubilant, since the share price is still down a very disappointing 33% in the last twelve months.
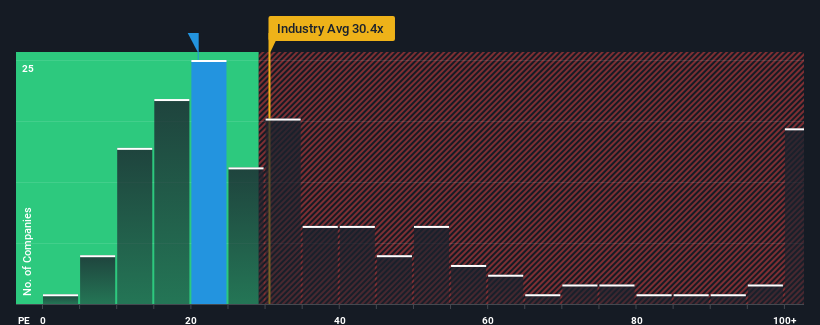
In spite of the firm bounce in price, Hamaton Automotive Technology may still be sending bullish signals at the moment with its price-to-earnings (or "P/E") ratio of 20.9x, since almost half of all companies in China have P/E ratios greater than 31x and even P/E's higher than 55x are not unusual. Although, it's not wise to just take the P/E at face value as there may be an explanation why it's limited.
With earnings that are retreating more than the market's of late, Hamaton Automotive Technology has been very sluggish. It seems that many are expecting the dismal earnings performance to persist, which has repressed the P/E. You'd much rather the company wasn't bleeding earnings if you still believe in the business. Or at the very least, you'd be hoping the earnings slide doesn't get any worse if your plan is to pick up some stock while it's out of favour.
View our latest analysis for Hamaton Automotive Technology
Is There Any Growth For Hamaton Automotive Technology?
In order to justify its P/E ratio, Hamaton Automotive Technology would need to produce sluggish growth that's trailing the market.
Retrospectively, the last year delivered a frustrating 26% decrease to the company's bottom line. Even so, admirably EPS has lifted 293% in aggregate from three years ago, notwithstanding the last 12 months. Accordingly, while they would have preferred to keep the run going, shareholders would probably welcome the medium-term rates of earnings growth.
Shifting to the future, estimates from the lone analyst covering the company suggest earnings should grow by 65% over the next year. With the market only predicted to deliver 41%, the company is positioned for a stronger earnings result.
With this information, we find it odd that Hamaton Automotive Technology is trading at a P/E lower than the market. Apparently some shareholders are doubtful of the forecasts and have been accepting significantly lower selling prices.
What We Can Learn From Hamaton Automotive Technology's P/E?
Hamaton Automotive Technology's stock might have been given a solid boost, but its P/E certainly hasn't reached any great heights. While the price-to-earnings ratio shouldn't be the defining factor in whether you buy a stock or not, it's quite a capable barometer of earnings expectations.
We've established that Hamaton Automotive Technology currently trades on a much lower than expected P/E since its forecast growth is higher than the wider market. When we see a strong earnings outlook with faster-than-market growth, we assume potential risks are what might be placing significant pressure on the P/E ratio. At least price risks look to be very low, but investors seem to think future earnings could see a lot of volatility.
Plus, you should also learn about this 1 warning sign we've spotted with Hamaton Automotive Technology.
It's important to make sure you look for a great company, not just the first idea you come across. So take a peek at this free list of interesting companies with strong recent earnings growth (and a low P/E).
Valuation is complex, but we're here to simplify it.
Discover if Hamaton Automotive Technology might be undervalued or overvalued with our detailed analysis, featuring fair value estimates, potential risks, dividends, insider trades, and its financial condition.
Access Free AnalysisHave feedback on this article? Concerned about the content? Get in touch with us directly. Alternatively, email editorial-team (at) simplywallst.com.
This article by Simply Wall St is general in nature. We provide commentary based on historical data and analyst forecasts only using an unbiased methodology and our articles are not intended to be financial advice. It does not constitute a recommendation to buy or sell any stock, and does not take account of your objectives, or your financial situation. We aim to bring you long-term focused analysis driven by fundamental data. Note that our analysis may not factor in the latest price-sensitive company announcements or qualitative material. Simply Wall St has no position in any stocks mentioned.
About SZSE:300643
Hamaton Automotive Technology
Manufactures and supplies various products to automotive industry worldwide.
Flawless balance sheet with solid track record.
Market Insights

Advertisement
Community Narratives
MicroVision will explode future revenue by 380.37% with a vision towards success
Fair Value US$60|98.4% undervalued
TH
Community Contributor
The Indispensable Artery for a New North American Economy
Fair Value CA$132.87|3.6% undervalued
TI
Community Contributor
Recently Updated Narratives
TI


TickerTickle on Oracle ·
The Quiet Giant That Became AI’s Power Grid
Fair Value:US$389.8148.6% undervalued
2 followersusers have followed this narrative
0 commentsusers have commented on this narrative
0 likesusers have liked this narrative
AU

AuCA on Nova Ljubljanska Banka d.d ·
Nova Ljubljanska Banka d.d will expect a 11.2% revenue boost driving future growth
Fair Value:€20916.0% undervalued
22 followersusers have followed this narrative
3 commentsusers have commented on this narrative
0 likesusers have liked this narrative
BI


BinocularMan on NVIDIA ·
The AI Infrastructure Giant Grows Into Its Valuation
Fair Value:US$345.0747.1% undervalued
1 followerusers have followed this narrative
0 commentsusers have commented on this narrative
0 likesusers have liked this narrative