
Advertisement
- China
- /
- Auto Components
- /
- SZSE:300375
Tianjin Pengling GroupLtd's (SZSE:300375) Returns On Capital Not Reflecting Well On The Business
Did you know there are some financial metrics that can provide clues of a potential multi-bagger? Firstly, we'd want to identify a growing return on capital employed (ROCE) and then alongside that, an ever-increasing base of capital employed. If you see this, it typically means it's a company with a great business model and plenty of profitable reinvestment opportunities. Having said that, from a first glance at Tianjin Pengling GroupLtd (SZSE:300375) we aren't jumping out of our chairs at how returns are trending, but let's have a deeper look.
Return On Capital Employed (ROCE): What Is It?
If you haven't worked with ROCE before, it measures the 'return' (pre-tax profit) a company generates from capital employed in its business. The formula for this calculation on Tianjin Pengling GroupLtd is:
Return on Capital Employed = Earnings Before Interest and Tax (EBIT) ÷ (Total Assets - Current Liabilities)
0.015 = CN¥36m ÷ (CN¥3.1b - CN¥799m) (Based on the trailing twelve months to September 2023).
So, Tianjin Pengling GroupLtd has an ROCE of 1.5%. In absolute terms, that's a low return and it also under-performs the Auto Components industry average of 5.8%.
View our latest analysis for Tianjin Pengling GroupLtd
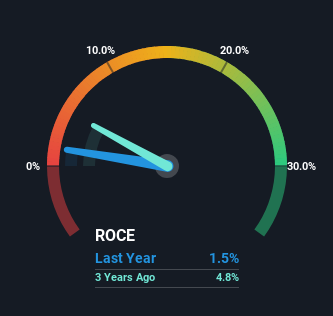
Historical performance is a great place to start when researching a stock so above you can see the gauge for Tianjin Pengling GroupLtd's ROCE against it's prior returns. If you'd like to look at how Tianjin Pengling GroupLtd has performed in the past in other metrics, you can view this free graph of Tianjin Pengling GroupLtd's past earnings, revenue and cash flow.
What Can We Tell From Tianjin Pengling GroupLtd's ROCE Trend?
In terms of Tianjin Pengling GroupLtd's historical ROCE movements, the trend isn't fantastic. To be more specific, ROCE has fallen from 5.1% over the last five years. Meanwhile, the business is utilizing more capital but this hasn't moved the needle much in terms of sales in the past 12 months, so this could reflect longer term investments. It's worth keeping an eye on the company's earnings from here on to see if these investments do end up contributing to the bottom line.
On a side note, Tianjin Pengling GroupLtd's current liabilities have increased over the last five years to 26% of total assets, effectively distorting the ROCE to some degree. If current liabilities hadn't increased as much as they did, the ROCE could actually be even lower. Keep an eye on this ratio, because the business could encounter some new risks if this metric gets too high.
What We Can Learn From Tianjin Pengling GroupLtd's ROCE
Bringing it all together, while we're somewhat encouraged by Tianjin Pengling GroupLtd's reinvestment in its own business, we're aware that returns are shrinking. And with the stock having returned a mere 15% in the last five years to shareholders, you could argue that they're aware of these lackluster trends. As a result, if you're hunting for a multi-bagger, we think you'd have more luck elsewhere.
Tianjin Pengling GroupLtd does have some risks, we noticed 4 warning signs (and 1 which is a bit concerning) we think you should know about.
For those who like to invest in solid companies, check out this free list of companies with solid balance sheets and high returns on equity.
Valuation is complex, but we're here to simplify it.
Discover if Tianjin Pengling GroupLtd might be undervalued or overvalued with our detailed analysis, featuring fair value estimates, potential risks, dividends, insider trades, and its financial condition.
Access Free AnalysisHave feedback on this article? Concerned about the content? Get in touch with us directly. Alternatively, email editorial-team (at) simplywallst.com.
This article by Simply Wall St is general in nature. We provide commentary based on historical data and analyst forecasts only using an unbiased methodology and our articles are not intended to be financial advice. It does not constitute a recommendation to buy or sell any stock, and does not take account of your objectives, or your financial situation. We aim to bring you long-term focused analysis driven by fundamental data. Note that our analysis may not factor in the latest price-sensitive company announcements or qualitative material. Simply Wall St has no position in any stocks mentioned.
About SZSE:300375
Tianjin Pengling GroupLtd
Engages in the research, development, and manufacture of automotive fluid pipelines and sealing parts in China and internationally.
Adequate balance sheet with questionable track record.
Market Insights

Advertisement
Community Narratives
MicroVision will explode future revenue by 380.37% with a vision towards success
Fair Value US$60.00|98.4% undervalued
TH
Community Contributor
The Indispensable Artery for a New North American Economy
Fair Value CA$132.87|1.3% undervalued
TI
Community Contributor