
Advertisement
- China
- /
- Auto Components
- /
- SZSE:002537
HyUnion HoldingLtd (SZSE:002537) Will Be Looking To Turn Around Its Returns
When it comes to investing, there are some useful financial metrics that can warn us when a business is potentially in trouble. A business that's potentially in decline often shows two trends, a return on capital employed (ROCE) that's declining, and a base of capital employed that's also declining. Ultimately this means that the company is earning less per dollar invested and on top of that, it's shrinking its base of capital employed. On that note, looking into HyUnion HoldingLtd (SZSE:002537), we weren't too upbeat about how things were going.
Return On Capital Employed (ROCE): What Is It?
If you haven't worked with ROCE before, it measures the 'return' (pre-tax profit) a company generates from capital employed in its business. To calculate this metric for HyUnion HoldingLtd, this is the formula:
Return on Capital Employed = Earnings Before Interest and Tax (EBIT) ÷ (Total Assets - Current Liabilities)
0.034 = CN¥171m ÷ (CN¥9.3b - CN¥4.3b) (Based on the trailing twelve months to March 2024).
So, HyUnion HoldingLtd has an ROCE of 3.4%. Ultimately, that's a low return and it under-performs the Auto Components industry average of 6.9%.
See our latest analysis for HyUnion HoldingLtd
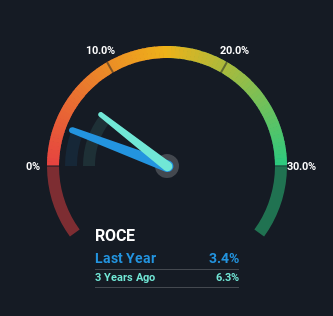
Historical performance is a great place to start when researching a stock so above you can see the gauge for HyUnion HoldingLtd's ROCE against it's prior returns. If you want to delve into the historical earnings , check out these free graphs detailing revenue and cash flow performance of HyUnion HoldingLtd.
What Does the ROCE Trend For HyUnion HoldingLtd Tell Us?
In terms of HyUnion HoldingLtd's historical ROCE trend, it isn't fantastic. Unfortunately, returns have declined substantially over the last five years to the 3.4% we see today. In addition to that, HyUnion HoldingLtd is now employing 28% less capital than it was five years ago. When you see both ROCE and capital employed diminishing, it can often be a sign of a mature and shrinking business that might be in structural decline. If these underlying trends continue, we wouldn't be too optimistic going forward.
On a side note, HyUnion HoldingLtd's current liabilities have increased over the last five years to 46% of total assets, effectively distorting the ROCE to some degree. Without this increase, it's likely that ROCE would be even lower than 3.4%. And with current liabilities at these levels, suppliers or short-term creditors are effectively funding a large part of the business, which can introduce some risks.
The Key Takeaway
To see HyUnion HoldingLtd reducing the capital employed in the business in tandem with diminishing returns, is concerning. It should come as no surprise then that the stock has fallen 35% over the last five years, so it looks like investors are recognizing these changes. Unless there is a shift to a more positive trajectory in these metrics, we would look elsewhere.
One more thing, we've spotted 1 warning sign facing HyUnion HoldingLtd that you might find interesting.
If you want to search for solid companies with great earnings, check out this free list of companies with good balance sheets and impressive returns on equity.
Valuation is complex, but we're here to simplify it.
Discover if HyUnion HoldingLtd might be undervalued or overvalued with our detailed analysis, featuring fair value estimates, potential risks, dividends, insider trades, and its financial condition.
Access Free AnalysisHave feedback on this article? Concerned about the content? Get in touch with us directly. Alternatively, email editorial-team (at) simplywallst.com.
This article by Simply Wall St is general in nature. We provide commentary based on historical data and analyst forecasts only using an unbiased methodology and our articles are not intended to be financial advice. It does not constitute a recommendation to buy or sell any stock, and does not take account of your objectives, or your financial situation. We aim to bring you long-term focused analysis driven by fundamental data. Note that our analysis may not factor in the latest price-sensitive company announcements or qualitative material. Simply Wall St has no position in any stocks mentioned.
About SZSE:002537
HyUnion HoldingLtd
Manufactures and sells automotive lightweight components for automobile brands, independent brands, and other original equipment manufacturers (OEM) in China.
Proven track record with adequate balance sheet.
Market Insights

Advertisement
Community Narratives
The company that turned a verb into a global necessity and basically runs the modern internet, digital ads, smartphones, maps, and AI.
Fair Value US$300.00|5.4% undervalued
OS
Community Contributor
Flowers Foods Pays A Fair Price For Health
Fair Value US$16.12|26.3% undervalued
NV
Community Contributor
TMX Group will thrive with 33.3% profit margin and enduring market moat
Fair Value CA$49.90|4.1% overvalued
LI
Community Contributor
The "Molecular Pencil": Why Beam's Technology is Built to Win
Fair Value US$65.01|62.7% undervalued
DA
Community Contributor