- China
- /
- Auto Components
- /
- SZSE:002328
Shanghai Xinpeng IndustryLtd (SZSE:002328) jumps 18% this week, though earnings growth is still tracking behind five-year shareholder returns


When we invest, we're generally looking for stocks that outperform the market average. And in our experience, buying the right stocks can give your wealth a significant boost. For example, the Shanghai Xinpeng Industry Co.,Ltd. (SZSE:002328) share price is up 37% in the last 5 years, clearly besting the market return of around 7.8% (ignoring dividends).
Since the stock has added CN¥594m to its market cap in the past week alone, let's see if underlying performance has been driving long-term returns.
View our latest analysis for Shanghai Xinpeng IndustryLtd
While the efficient markets hypothesis continues to be taught by some, it has been proven that markets are over-reactive dynamic systems, and investors are not always rational. One imperfect but simple way to consider how the market perception of a company has shifted is to compare the change in the earnings per share (EPS) with the share price movement.
During five years of share price growth, Shanghai Xinpeng IndustryLtd achieved compound earnings per share (EPS) growth of 4.9% per year. This EPS growth is lower than the 7% average annual increase in the share price. This suggests that market participants hold the company in higher regard, these days. And that's hardly shocking given the track record of growth.
You can see below how EPS has changed over time (discover the exact values by clicking on the image).
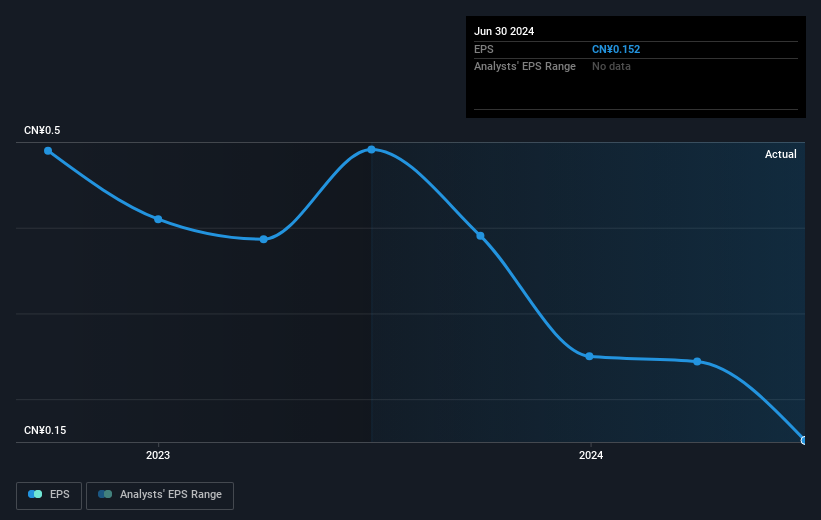
Dive deeper into Shanghai Xinpeng IndustryLtd's key metrics by checking this interactive graph of Shanghai Xinpeng IndustryLtd's earnings, revenue and cash flow.
What About Dividends?
When looking at investment returns, it is important to consider the difference between total shareholder return (TSR) and share price return. The TSR is a return calculation that accounts for the value of cash dividends (assuming that any dividend received was reinvested) and the calculated value of any discounted capital raisings and spin-offs. So for companies that pay a generous dividend, the TSR is often a lot higher than the share price return. In the case of Shanghai Xinpeng IndustryLtd, it has a TSR of 56% for the last 5 years. That exceeds its share price return that we previously mentioned. This is largely a result of its dividend payments!
A Different Perspective
While the broader market lost about 6.0% in the twelve months, Shanghai Xinpeng IndustryLtd shareholders did even worse, losing 17% (even including dividends). Having said that, it's inevitable that some stocks will be oversold in a falling market. The key is to keep your eyes on the fundamental developments. On the bright side, long term shareholders have made money, with a gain of 9% per year over half a decade. If the fundamental data continues to indicate long term sustainable growth, the current sell-off could be an opportunity worth considering. While it is well worth considering the different impacts that market conditions can have on the share price, there are other factors that are even more important. To that end, you should be aware of the 3 warning signs we've spotted with Shanghai Xinpeng IndustryLtd .
For those who like to find winning investments this free list of undervalued companies with recent insider purchasing, could be just the ticket.
Please note, the market returns quoted in this article reflect the market weighted average returns of stocks that currently trade on Chinese exchanges.
New: Manage All Your Stock Portfolios in One Place
We've created the ultimate portfolio companion for stock investors, and it's free.
• Connect an unlimited number of Portfolios and see your total in one currency
• Be alerted to new Warning Signs or Risks via email or mobile
• Track the Fair Value of your stocks
Have feedback on this article? Concerned about the content? Get in touch with us directly. Alternatively, email editorial-team (at) simplywallst.com.
This article by Simply Wall St is general in nature. We provide commentary based on historical data and analyst forecasts only using an unbiased methodology and our articles are not intended to be financial advice. It does not constitute a recommendation to buy or sell any stock, and does not take account of your objectives, or your financial situation. We aim to bring you long-term focused analysis driven by fundamental data. Note that our analysis may not factor in the latest price-sensitive company announcements or qualitative material. Simply Wall St has no position in any stocks mentioned.
About SZSE:002328
Shanghai Xinpeng IndustryLtd
Develops, manufactures, and sells metal electromechanical parts in China and internationally.
Excellent balance sheet and fair value.

