- China
- /
- Auto Components
- /
- SHSE:605228
Shentong Technology Group Co., Ltd's (SHSE:605228) Stock is Soaring But Financials Seem Inconsistent: Will The Uptrend Continue?


Shentong Technology Group's (SHSE:605228) stock is up by a considerable 17% over the past three months. However, we decided to pay attention to the company's fundamentals which don't appear to give a clear sign about the company's financial health. In this article, we decided to focus on Shentong Technology Group's ROE.
ROE or return on equity is a useful tool to assess how effectively a company can generate returns on the investment it received from its shareholders. In simpler terms, it measures the profitability of a company in relation to shareholder's equity.
Check out our latest analysis for Shentong Technology Group
How Is ROE Calculated?
Return on equity can be calculated by using the formula:
Return on Equity = Net Profit (from continuing operations) ÷ Shareholders' Equity
So, based on the above formula, the ROE for Shentong Technology Group is:
4.1% = CN¥64m ÷ CN¥1.6b (Based on the trailing twelve months to March 2024).
The 'return' is the profit over the last twelve months. That means that for every CN¥1 worth of shareholders' equity, the company generated CN¥0.04 in profit.
What Is The Relationship Between ROE And Earnings Growth?
Thus far, we have learned that ROE measures how efficiently a company is generating its profits. We now need to evaluate how much profit the company reinvests or "retains" for future growth which then gives us an idea about the growth potential of the company. Assuming everything else remains unchanged, the higher the ROE and profit retention, the higher the growth rate of a company compared to companies that don't necessarily bear these characteristics.
A Side By Side comparison of Shentong Technology Group's Earnings Growth And 4.1% ROE
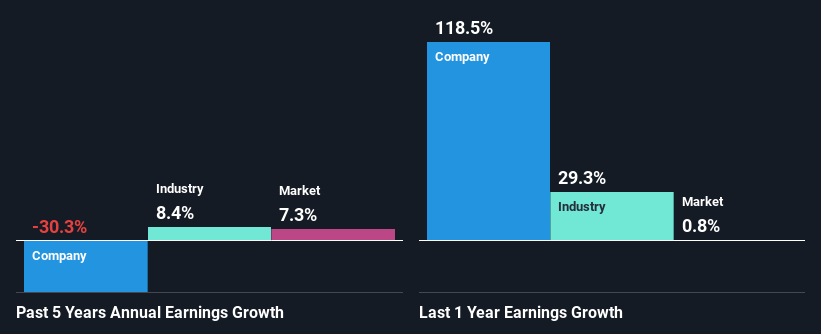
As you can see, Shentong Technology Group's ROE looks pretty weak. Not just that, even compared to the industry average of 8.1%, the company's ROE is entirely unremarkable. For this reason, Shentong Technology Group's five year net income decline of 30% is not surprising given its lower ROE. However, there could also be other factors causing the earnings to decline. Such as - low earnings retention or poor allocation of capital.
However, when we compared Shentong Technology Group's growth with the industry we found that while the company's earnings have been shrinking, the industry has seen an earnings growth of 8.4% in the same period. This is quite worrisome.
The basis for attaching value to a company is, to a great extent, tied to its earnings growth. It’s important for an investor to know whether the market has priced in the company's expected earnings growth (or decline). Doing so will help them establish if the stock's future looks promising or ominous. Is 605228 fairly valued? This infographic on the company's intrinsic value has everything you need to know.
Is Shentong Technology Group Using Its Retained Earnings Effectively?
In spite of a normal three-year median payout ratio of 38% (that is, a retention ratio of 62%), the fact that Shentong Technology Group's earnings have shrunk is quite puzzling. So there might be other factors at play here which could potentially be hampering growth. For example, the business has faced some headwinds.
Additionally, Shentong Technology Group has paid dividends over a period of three years, which means that the company's management is rather focused on keeping up its dividend payments, regardless of the shrinking earnings.
Summary
On the whole, we feel that the performance shown by Shentong Technology Group can be open to many interpretations. While the company does have a high rate of profit retention, its low rate of return is probably hampering its earnings growth. Wrapping up, we would proceed with caution with this company and one way of doing that would be to look at the risk profile of the business. You can see the 3 risks we have identified for Shentong Technology Group by visiting our risks dashboard for free on our platform here.
New: Manage All Your Stock Portfolios in One Place
We've created the ultimate portfolio companion for stock investors, and it's free.
• Connect an unlimited number of Portfolios and see your total in one currency
• Be alerted to new Warning Signs or Risks via email or mobile
• Track the Fair Value of your stocks
Have feedback on this article? Concerned about the content? Get in touch with us directly. Alternatively, email editorial-team (at) simplywallst.com.
This article by Simply Wall St is general in nature. We provide commentary based on historical data and analyst forecasts only using an unbiased methodology and our articles are not intended to be financial advice. It does not constitute a recommendation to buy or sell any stock, and does not take account of your objectives, or your financial situation. We aim to bring you long-term focused analysis driven by fundamental data. Note that our analysis may not factor in the latest price-sensitive company announcements or qualitative material. Simply Wall St has no position in any stocks mentioned.
About SHSE:605228
Shentong Technology Group
Develops, manufactures, and sells automotive parts in China.
Flawless balance sheet with proven track record.

