- China
- /
- Auto Components
- /
- SHSE:601163
Triangle TyreLtd (SHSE:601163) sheds 3.1% this week, as yearly returns fall more in line with earnings growth


Triangle Tyre Co.,Ltd (SHSE:601163) shareholders might be concerned after seeing the share price drop 11% in the last month. Looking further back, the stock has generated good profits over five years. It has returned a market beating 29% in that time.
Since the long term performance has been good but there's been a recent pullback of 3.1%, let's check if the fundamentals match the share price.
See our latest analysis for Triangle TyreLtd
To paraphrase Benjamin Graham: Over the short term the market is a voting machine, but over the long term it's a weighing machine. By comparing earnings per share (EPS) and share price changes over time, we can get a feel for how investor attitudes to a company have morphed over time.
Over half a decade, Triangle TyreLtd managed to grow its earnings per share at 22% a year. This EPS growth is higher than the 5% average annual increase in the share price. So one could conclude that the broader market has become more cautious towards the stock. The reasonably low P/E ratio of 8.68 also suggests market apprehension.
The graphic below depicts how EPS has changed over time (unveil the exact values by clicking on the image).
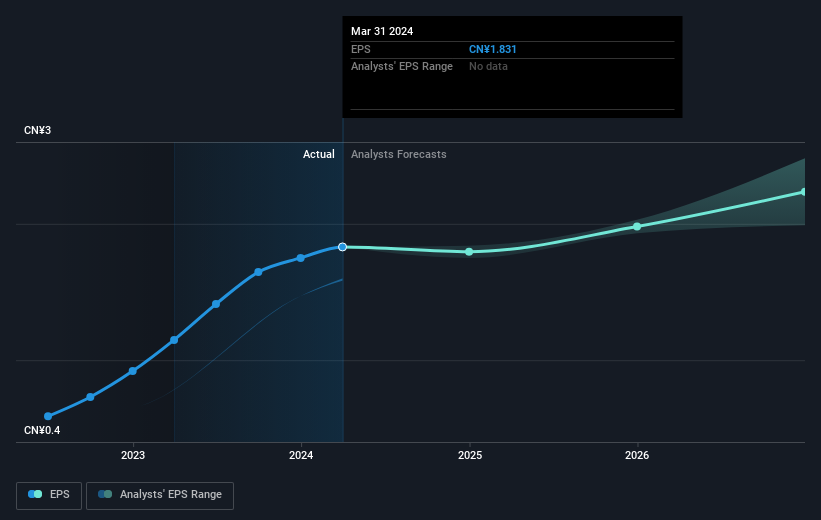
We know that Triangle TyreLtd has improved its bottom line lately, but is it going to grow revenue? You could check out this free report showing analyst revenue forecasts.
What About Dividends?
As well as measuring the share price return, investors should also consider the total shareholder return (TSR). The TSR is a return calculation that accounts for the value of cash dividends (assuming that any dividend received was reinvested) and the calculated value of any discounted capital raisings and spin-offs. It's fair to say that the TSR gives a more complete picture for stocks that pay a dividend. We note that for Triangle TyreLtd the TSR over the last 5 years was 43%, which is better than the share price return mentioned above. The dividends paid by the company have thusly boosted the total shareholder return.
A Different Perspective
It's nice to see that Triangle TyreLtd shareholders have received a total shareholder return of 4.7% over the last year. And that does include the dividend. However, that falls short of the 7% TSR per annum it has made for shareholders, each year, over five years. Potential buyers might understandably feel they've missed the opportunity, but it's always possible business is still firing on all cylinders. I find it very interesting to look at share price over the long term as a proxy for business performance. But to truly gain insight, we need to consider other information, too. Case in point: We've spotted 1 warning sign for Triangle TyreLtd you should be aware of.
We will like Triangle TyreLtd better if we see some big insider buys. While we wait, check out this free list of undervalued stocks (mostly small caps) with considerable, recent, insider buying.
Please note, the market returns quoted in this article reflect the market weighted average returns of stocks that currently trade on Chinese exchanges.
Valuation is complex, but we're here to simplify it.
Discover if Triangle TyreLtd might be undervalued or overvalued with our detailed analysis, featuring fair value estimates, potential risks, dividends, insider trades, and its financial condition.
Access Free AnalysisHave feedback on this article? Concerned about the content? Get in touch with us directly. Alternatively, email editorial-team (at) simplywallst.com.
This article by Simply Wall St is general in nature. We provide commentary based on historical data and analyst forecasts only using an unbiased methodology and our articles are not intended to be financial advice. It does not constitute a recommendation to buy or sell any stock, and does not take account of your objectives, or your financial situation. We aim to bring you long-term focused analysis driven by fundamental data. Note that our analysis may not factor in the latest price-sensitive company announcements or qualitative material. Simply Wall St has no position in any stocks mentioned.
About SHSE:601163
Triangle TyreLtd
Engages in the research and development, design, manufacture, and marketing of tire products in China.
Flawless balance sheet with solid track record and pays a dividend.
