Stock Analysis
- Switzerland
- /
- Life Sciences
- /
- SWX:SKAN
SKAN Group AG (VTX:SKAN) Stock Has Shown Weakness Lately But Financials Look Strong: Should Prospective Shareholders Make The Leap?

It is hard to get excited after looking at SKAN Group's (VTX:SKAN) recent performance, when its stock has declined 4.2% over the past week. However, a closer look at its sound financials might cause you to think again. Given that fundamentals usually drive long-term market outcomes, the company is worth looking at. In this article, we decided to focus on SKAN Group's ROE.
ROE or return on equity is a useful tool to assess how effectively a company can generate returns on the investment it received from its shareholders. In short, ROE shows the profit each dollar generates with respect to its shareholder investments.
See our latest analysis for SKAN Group
How To Calculate Return On Equity?
The formula for return on equity is:
Return on Equity = Net Profit (from continuing operations) ÷ Shareholders' Equity
So, based on the above formula, the ROE for SKAN Group is:
18% = CHF29m ÷ CHF162m (Based on the trailing twelve months to June 2023).
The 'return' is the yearly profit. That means that for every CHF1 worth of shareholders' equity, the company generated CHF0.18 in profit.
What Is The Relationship Between ROE And Earnings Growth?
So far, we've learned that ROE is a measure of a company's profitability. Based on how much of its profits the company chooses to reinvest or "retain", we are then able to evaluate a company's future ability to generate profits. Generally speaking, other things being equal, firms with a high return on equity and profit retention, have a higher growth rate than firms that don’t share these attributes.
A Side By Side comparison of SKAN Group's Earnings Growth And 18% ROE
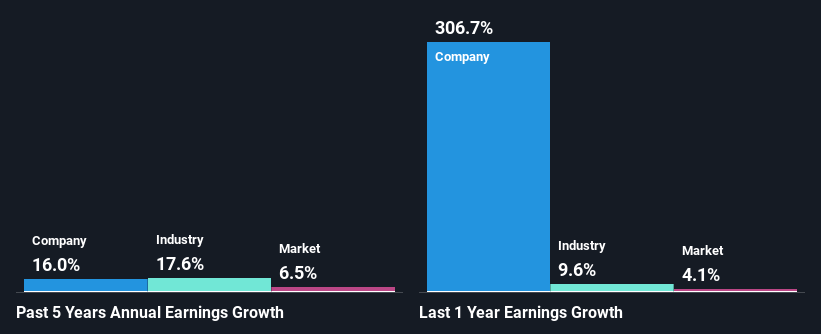
At first glance, SKAN Group seems to have a decent ROE. On comparing with the average industry ROE of 9.5% the company's ROE looks pretty remarkable. Probably as a result of this, SKAN Group was able to see a decent growth of 16% over the last five years.
We then performed a comparison between SKAN Group's net income growth with the industry, which revealed that the company's growth is similar to the average industry growth of 18% in the same 5-year period.
Earnings growth is an important metric to consider when valuing a stock. It’s important for an investor to know whether the market has priced in the company's expected earnings growth (or decline). Doing so will help them establish if the stock's future looks promising or ominous. What is SKAN worth today? The intrinsic value infographic in our free research report helps visualize whether SKAN is currently mispriced by the market.
Is SKAN Group Making Efficient Use Of Its Profits?
SKAN Group has a healthy combination of a moderate three-year median payout ratio of 43% (or a retention ratio of 57%) and a respectable amount of growth in earnings as we saw above, meaning that the company has been making efficient use of its profits.
Additionally, SKAN Group has paid dividends over a period of at least ten years which means that the company is pretty serious about sharing its profits with shareholders. Our latest analyst data shows that the future payout ratio of the company is expected to drop to 31% over the next three years.
Summary
On the whole, we feel that SKAN Group's performance has been quite good. Particularly, we like that the company is reinvesting heavily into its business, and at a high rate of return. Unsurprisingly, this has led to an impressive earnings growth. That being so, the latest analyst forecasts show that the company will continue to see an expansion in its earnings. Are these analysts expectations based on the broad expectations for the industry, or on the company's fundamentals? Click here to be taken to our analyst's forecasts page for the company.
Valuation is complex, but we're helping make it simple.
Find out whether SKAN Group is potentially over or undervalued by checking out our comprehensive analysis, which includes fair value estimates, risks and warnings, dividends, insider transactions and financial health.
View the Free AnalysisHave feedback on this article? Concerned about the content? Get in touch with us directly. Alternatively, email editorial-team (at) simplywallst.com.
This article by Simply Wall St is general in nature. We provide commentary based on historical data and analyst forecasts only using an unbiased methodology and our articles are not intended to be financial advice. It does not constitute a recommendation to buy or sell any stock, and does not take account of your objectives, or your financial situation. We aim to bring you long-term focused analysis driven by fundamental data. Note that our analysis may not factor in the latest price-sensitive company announcements or qualitative material. Simply Wall St has no position in any stocks mentioned.
About SWX:SKAN
SKAN Group
SKAN Group AG, together with its subsidiaries, provides isolators, cleanroom devices, and decontamination processes for pharmaceutical and chemical industries in Asia, Europe, the Americas, and internationally.
Excellent balance sheet with reasonable growth potential.

