
Advertisement
- Switzerland
- /
- Packaging
- /
- SWX:SIGN
We Like These Underlying Return On Capital Trends At SIG Group (VTX:SIGN)
To find a multi-bagger stock, what are the underlying trends we should look for in a business? In a perfect world, we'd like to see a company investing more capital into its business and ideally the returns earned from that capital are also increasing. If you see this, it typically means it's a company with a great business model and plenty of profitable reinvestment opportunities. With that in mind, we've noticed some promising trends at SIG Group (VTX:SIGN) so let's look a bit deeper.
Return On Capital Employed (ROCE): What Is It?
For those who don't know, ROCE is a measure of a company's yearly pre-tax profit (its return), relative to the capital employed in the business. Analysts use this formula to calculate it for SIG Group:
Return on Capital Employed = Earnings Before Interest and Tax (EBIT) ÷ (Total Assets - Current Liabilities)
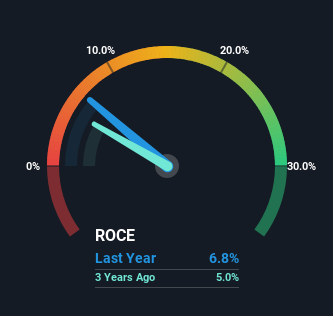
0.068 = €376m ÷ (€7.7b - €2.1b) (Based on the trailing twelve months to December 2024).
So, SIG Group has an ROCE of 6.8%. Ultimately, that's a low return and it under-performs the Packaging industry average of 9.5%.
See our latest analysis for SIG Group
Above you can see how the current ROCE for SIG Group compares to its prior returns on capital, but there's only so much you can tell from the past. If you'd like, you can check out the forecasts from the analysts covering SIG Group for free.
What The Trend Of ROCE Can Tell Us
While in absolute terms it isn't a high ROCE, it's promising to see that it has been moving in the right direction. Over the last five years, returns on capital employed have risen substantially to 6.8%. The company is effectively making more money per dollar of capital used, and it's worth noting that the amount of capital has increased too, by 38%. The increasing returns on a growing amount of capital is common amongst multi-baggers and that's why we're impressed.
On a side note, we noticed that the improvement in ROCE appears to be partly fueled by an increase in current liabilities. Effectively this means that suppliers or short-term creditors are now funding 28% of the business, which is more than it was five years ago. Keep an eye out for future increases because when the ratio of current liabilities to total assets gets particularly high, this can introduce some new risks for the business.
The Bottom Line On SIG Group's ROCE
In summary, it's great to see that SIG Group can compound returns by consistently reinvesting capital at increasing rates of return, because these are some of the key ingredients of those highly sought after multi-baggers. Considering the stock has delivered 4.6% to its stockholders over the last five years, it may be fair to think that investors aren't fully aware of the promising trends yet. So exploring more about this stock could uncover a good opportunity, if the valuation and other metrics stack up.
If you'd like to know about the risks facing SIG Group, we've discovered 3 warning signs that you should be aware of.
For those who like to invest in solid companies, check out this free list of companies with solid balance sheets and high returns on equity.
New: Manage All Your Stock Portfolios in One Place
We've created the ultimate portfolio companion for stock investors, and it's free.
• Connect an unlimited number of Portfolios and see your total in one currency
• Be alerted to new Warning Signs or Risks via email or mobile
• Track the Fair Value of your stocks
Have feedback on this article? Concerned about the content? Get in touch with us directly. Alternatively, email editorial-team (at) simplywallst.com.
This article by Simply Wall St is general in nature. We provide commentary based on historical data and analyst forecasts only using an unbiased methodology and our articles are not intended to be financial advice. It does not constitute a recommendation to buy or sell any stock, and does not take account of your objectives, or your financial situation. We aim to bring you long-term focused analysis driven by fundamental data. Note that our analysis may not factor in the latest price-sensitive company announcements or qualitative material. Simply Wall St has no position in any stocks mentioned.
About SWX:SIGN
SIG Group
Provides aseptic carton packaging systems and solutions for beverage and liquid food products.
Good value with moderate growth potential.
Similar Companies
Market Insights

Advertisement
Community Narratives
MicroVision will explode future revenue by 380.37% with a vision towards success
Fair Value US$60.00|98.4% undervalued
TH
Community Contributor
The Indispensable Artery for a New North American Economy
Fair Value CA$132.87|1.3% undervalued
TI
Community Contributor