
Advertisement
- Switzerland
- /
- Healthcare Services
- /
- SWX:SHLTN
SHL Telemedicine Ltd.'s (VTX:SHLTN) 29% Dip Still Leaving Some Shareholders Feeling Restless Over Its P/SRatio
Unfortunately for some shareholders, the SHL Telemedicine Ltd. (VTX:SHLTN) share price has dived 29% in the last thirty days, prolonging recent pain. The recent drop completes a disastrous twelve months for shareholders, who are sitting on a 67% loss during that time.
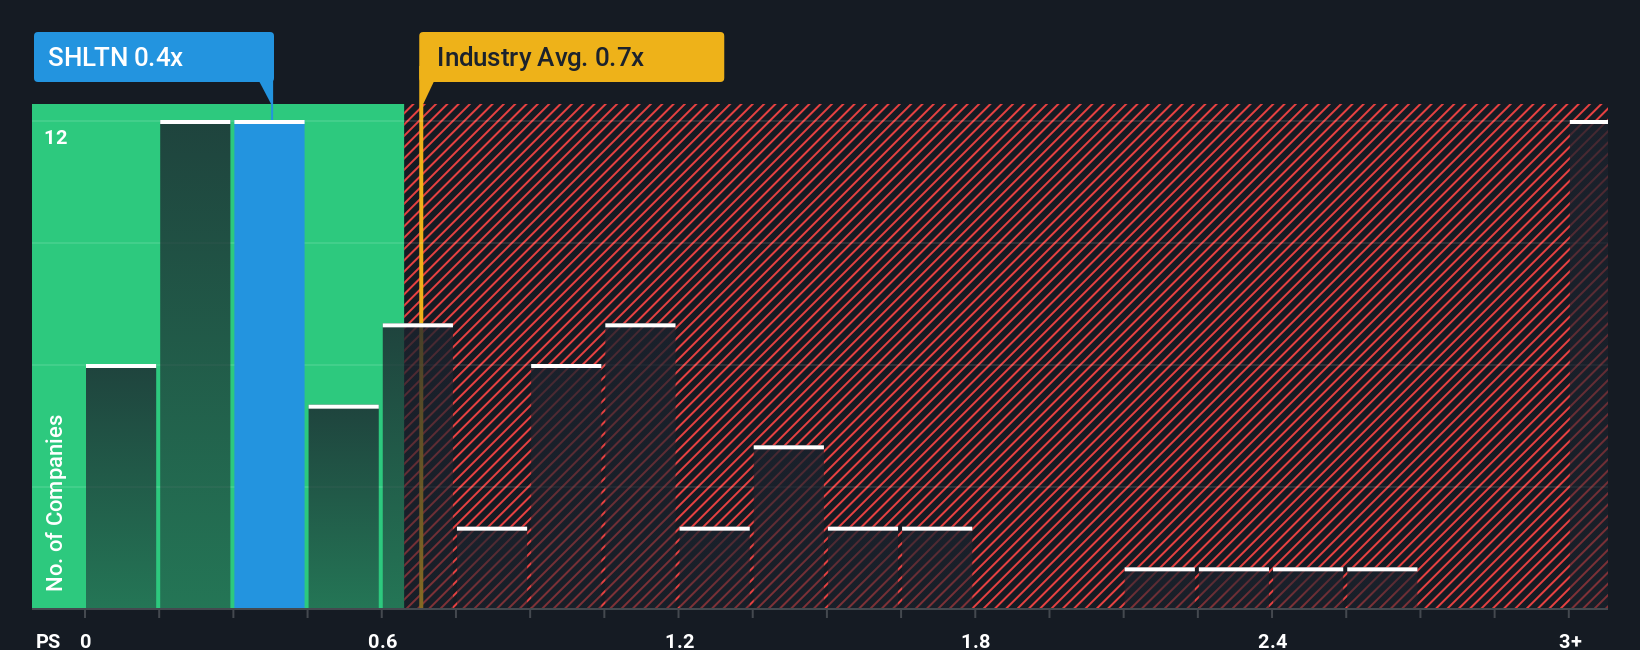
Even after such a large drop in price, you could still be forgiven for feeling indifferent about SHL Telemedicine's P/S ratio of 0.4x, since the median price-to-sales (or "P/S") ratio for the Healthcare industry in Switzerland is also close to 0.7x. Although, it's not wise to simply ignore the P/S without explanation as investors may be disregarding a distinct opportunity or a costly mistake.
View our latest analysis for SHL Telemedicine
How Has SHL Telemedicine Performed Recently?
For example, consider that SHL Telemedicine's financial performance has been pretty ordinary lately as revenue growth is non-existent. Perhaps the market believes the recent run-of-the-mill revenue performance isn't enough to outperform the industry, which has kept the P/S muted. If you like the company, you'd be hoping this isn't the case so that you could potentially pick up some stock while it's not quite in favour.
Want the full picture on earnings, revenue and cash flow for the company? Then our free report on SHL Telemedicine will help you shine a light on its historical performance.Is There Some Revenue Growth Forecasted For SHL Telemedicine?
The only time you'd be comfortable seeing a P/S like SHL Telemedicine's is when the company's growth is tracking the industry closely.
Retrospectively, the last year delivered virtually the same number to the company's top line as the year before. Whilst it's an improvement, it wasn't enough to get the company out of the hole it was in, with revenue down 4.4% overall from three years ago. Therefore, it's fair to say the revenue growth recently has been undesirable for the company.
In contrast to the company, the rest of the industry is expected to grow by 4.7% over the next year, which really puts the company's recent medium-term revenue decline into perspective.
In light of this, it's somewhat alarming that SHL Telemedicine's P/S sits in line with the majority of other companies. Apparently many investors in the company are way less bearish than recent times would indicate and aren't willing to let go of their stock right now. Only the boldest would assume these prices are sustainable as a continuation of recent revenue trends is likely to weigh on the share price eventually.
The Bottom Line On SHL Telemedicine's P/S
With its share price dropping off a cliff, the P/S for SHL Telemedicine looks to be in line with the rest of the Healthcare industry. Using the price-to-sales ratio alone to determine if you should sell your stock isn't sensible, however it can be a practical guide to the company's future prospects.
The fact that SHL Telemedicine currently trades at a P/S on par with the rest of the industry is surprising to us since its recent revenues have been in decline over the medium-term, all while the industry is set to grow. Even though it matches the industry, we're uncomfortable with the current P/S ratio, as this dismal revenue performance is unlikely to support a more positive sentiment for long. If recent medium-term revenue trends continue, it will place shareholders' investments at risk and potential investors in danger of paying an unnecessary premium.
We don't want to rain on the parade too much, but we did also find 3 warning signs for SHL Telemedicine (2 are concerning!) that you need to be mindful of.
If these risks are making you reconsider your opinion on SHL Telemedicine, explore our interactive list of high quality stocks to get an idea of what else is out there.
New: Manage All Your Stock Portfolios in One Place
We've created the ultimate portfolio companion for stock investors, and it's free.
• Connect an unlimited number of Portfolios and see your total in one currency
• Be alerted to new Warning Signs or Risks via email or mobile
• Track the Fair Value of your stocks
Have feedback on this article? Concerned about the content? Get in touch with us directly. Alternatively, email editorial-team (at) simplywallst.com.
This article by Simply Wall St is general in nature. We provide commentary based on historical data and analyst forecasts only using an unbiased methodology and our articles are not intended to be financial advice. It does not constitute a recommendation to buy or sell any stock, and does not take account of your objectives, or your financial situation. We aim to bring you long-term focused analysis driven by fundamental data. Note that our analysis may not factor in the latest price-sensitive company announcements or qualitative material. Simply Wall St has no position in any stocks mentioned.
About SWX:SHLTN
SHL Telemedicine
Provides telemedicine services in Israel, Europe, and internationally.
Adequate balance sheet with low risk.
Similar Companies
Market Insights

Advertisement
Community Narratives
MicroVision will explode future revenue by 380.37% with a vision towards success
Fair Value US$60.00|98.3% undervalued
TH
Community Contributor
The Indispensable Artery for a New North American Economy
Fair Value CA$132.87|1.0% undervalued
TI
Community Contributor