
Advertisement
- Switzerland
- /
- Machinery
- /
- SWX:SFSN
These 4 Measures Indicate That SFS Group (VTX:SFSN) Is Using Debt Reasonably Well
The external fund manager backed by Berkshire Hathaway's Charlie Munger, Li Lu, makes no bones about it when he says 'The biggest investment risk is not the volatility of prices, but whether you will suffer a permanent loss of capital.' When we think about how risky a company is, we always like to look at its use of debt, since debt overload can lead to ruin. As with many other companies SFS Group AG (VTX:SFSN) makes use of debt. But should shareholders be worried about its use of debt?
Why Does Debt Bring Risk?
Debt assists a business until the business has trouble paying it off, either with new capital or with free cash flow. Ultimately, if the company can't fulfill its legal obligations to repay debt, shareholders could walk away with nothing. However, a more common (but still painful) scenario is that it has to raise new equity capital at a low price, thus permanently diluting shareholders. Having said that, the most common situation is where a company manages its debt reasonably well - and to its own advantage. When we think about a company's use of debt, we first look at cash and debt together.
View our latest analysis for SFS Group
What Is SFS Group's Debt?
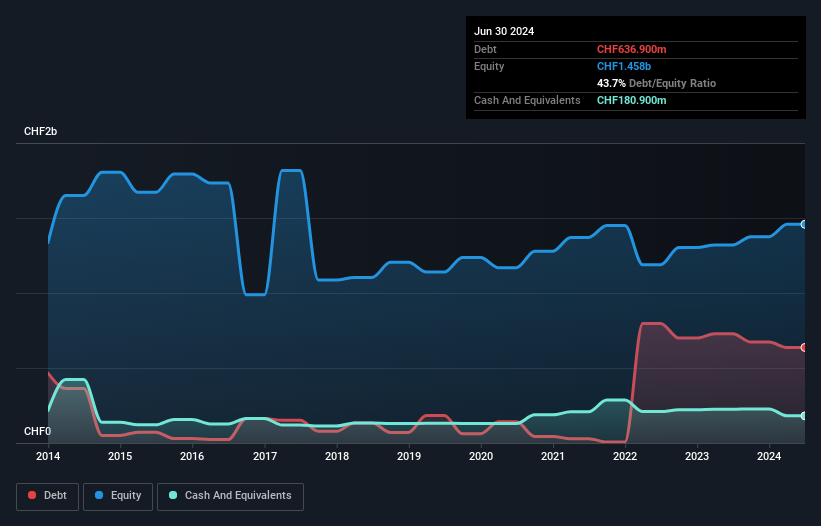
As you can see below, SFS Group had CHF636.9m of debt at June 2024, down from CHF729.0m a year prior. However, it also had CHF180.9m in cash, and so its net debt is CHF456.0m.
A Look At SFS Group's Liabilities
The latest balance sheet data shows that SFS Group had liabilities of CHF675.9m due within a year, and liabilities of CHF465.0m falling due after that. Offsetting these obligations, it had cash of CHF180.9m as well as receivables valued at CHF589.2m due within 12 months. So its liabilities total CHF370.8m more than the combination of its cash and short-term receivables.
Of course, SFS Group has a market capitalization of CHF5.05b, so these liabilities are probably manageable. However, we do think it is worth keeping an eye on its balance sheet strength, as it may change over time.
We use two main ratios to inform us about debt levels relative to earnings. The first is net debt divided by earnings before interest, tax, depreciation, and amortization (EBITDA), while the second is how many times its earnings before interest and tax (EBIT) covers its interest expense (or its interest cover, for short). Thus we consider debt relative to earnings both with and without depreciation and amortization expenses.
SFS Group's net debt is only 0.97 times its EBITDA. And its EBIT easily covers its interest expense, being 10.3 times the size. So we're pretty relaxed about its super-conservative use of debt. On the other hand, SFS Group saw its EBIT drop by 2.6% in the last twelve months. That sort of decline, if sustained, will obviously make debt harder to handle. The balance sheet is clearly the area to focus on when you are analysing debt. But it is future earnings, more than anything, that will determine SFS Group's ability to maintain a healthy balance sheet going forward. So if you want to see what the professionals think, you might find this free report on analyst profit forecasts to be interesting.
But our final consideration is also important, because a company cannot pay debt with paper profits; it needs cold hard cash. So we always check how much of that EBIT is translated into free cash flow. Looking at the most recent three years, SFS Group recorded free cash flow of 46% of its EBIT, which is weaker than we'd expect. That weak cash conversion makes it more difficult to handle indebtedness.
Our View
SFS Group's interest cover suggests it can handle its debt as easily as Cristiano Ronaldo could score a goal against an under 14's goalkeeper. But, on a more sombre note, we are a little concerned by its EBIT growth rate. Looking at all the aforementioned factors together, it strikes us that SFS Group can handle its debt fairly comfortably. Of course, while this leverage can enhance returns on equity, it does bring more risk, so it's worth keeping an eye on this one. Over time, share prices tend to follow earnings per share, so if you're interested in SFS Group, you may well want to click here to check an interactive graph of its earnings per share history.
Of course, if you're the type of investor who prefers buying stocks without the burden of debt, then don't hesitate to discover our exclusive list of net cash growth stocks, today.
New: Manage All Your Stock Portfolios in One Place
We've created the ultimate portfolio companion for stock investors, and it's free.
• Connect an unlimited number of Portfolios and see your total in one currency
• Be alerted to new Warning Signs or Risks via email or mobile
• Track the Fair Value of your stocks
Have feedback on this article? Concerned about the content? Get in touch with us directly. Alternatively, email editorial-team (at) simplywallst.com.
This article by Simply Wall St is general in nature. We provide commentary based on historical data and analyst forecasts only using an unbiased methodology and our articles are not intended to be financial advice. It does not constitute a recommendation to buy or sell any stock, and does not take account of your objectives, or your financial situation. We aim to bring you long-term focused analysis driven by fundamental data. Note that our analysis may not factor in the latest price-sensitive company announcements or qualitative material. Simply Wall St has no position in any stocks mentioned.
About SWX:SFSN
SFS Group
Supplies precision components and assemblies, mechanical fastening systems, tools, and procurement solutions in Switzerland and internationally.
Very undervalued with excellent balance sheet and pays a dividend.
Similar Companies
Market Insights

Advertisement
Community Narratives
MicroVision will explode future revenue by 380.37% with a vision towards success
Fair Value US$60.00|98.5% undervalued
TH
Community Contributor
The Indispensable Artery for a New North American Economy
Fair Value CA$132.87|1.3% undervalued
TI
Community Contributor