Has Firan Technology Group Corporation's (TSE:FTG) Impressive Stock Performance Got Anything to Do With Its Fundamentals?


Firan Technology Group (TSE:FTG) has had a great run on the share market with its stock up by a significant 15% over the last month. Given that stock prices are usually aligned with a company's financial performance in the long-term, we decided to study its financial indicators more closely to see if they had a hand to play in the recent price move. In this article, we decided to focus on Firan Technology Group's ROE.
Return on Equity or ROE is a test of how effectively a company is growing its value and managing investors’ money. Put another way, it reveals the company's success at turning shareholder investments into profits.
Check out our latest analysis for Firan Technology Group
How Is ROE Calculated?
The formula for ROE is:
Return on Equity = Net Profit (from continuing operations) ÷ Shareholders' Equity
So, based on the above formula, the ROE for Firan Technology Group is:
16% = CA$8.7m ÷ CA$56m (Based on the trailing twelve months to September 2023).
The 'return' is the amount earned after tax over the last twelve months. Another way to think of that is that for every CA$1 worth of equity, the company was able to earn CA$0.16 in profit.
What Has ROE Got To Do With Earnings Growth?
Thus far, we have learned that ROE measures how efficiently a company is generating its profits. Depending on how much of these profits the company reinvests or "retains", and how effectively it does so, we are then able to assess a company’s earnings growth potential. Assuming all else is equal, companies that have both a higher return on equity and higher profit retention are usually the ones that have a higher growth rate when compared to companies that don't have the same features.
Firan Technology Group's Earnings Growth And 16% ROE
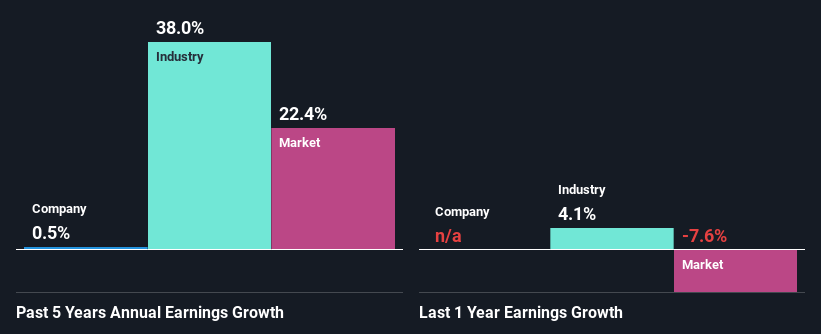
To start with, Firan Technology Group's ROE looks acceptable. Further, the company's ROE is similar to the industry average of 16%. However, we are curious as to how Firan Technology Group's decent returns still resulted in flat growth for Firan Technology Group in the past five years. So, there could be some other aspects that could potentially be preventing the company from growing. Such as, the company pays out a huge portion of its earnings as dividends, or is faced with competitive pressures.
As a next step, we compared Firan Technology Group's net income growth with the industry and were disappointed to see that the company's growth is lower than the industry average growth of 38% in the same period.
Earnings growth is a huge factor in stock valuation. It’s important for an investor to know whether the market has priced in the company's expected earnings growth (or decline). Doing so will help them establish if the stock's future looks promising or ominous. If you're wondering about Firan Technology Group's's valuation, check out this gauge of its price-to-earnings ratio, as compared to its industry.
Is Firan Technology Group Using Its Retained Earnings Effectively?
Firan Technology Group doesn't pay any dividend, meaning that potentially all of its profits are being reinvested in the business. However, this doesn't explain why the company hasn't seen any growth. So there could be some other explanations in that regard. For instance, the company's business may be deteriorating.
Conclusion
Overall, we feel that Firan Technology Group certainly does have some positive factors to consider. Although, we are disappointed to see a lack of growth in earnings even in spite of a high ROE and and a high reinvestment rate. We believe that there might be some outside factors that could be having a negative impact on the business. With that said, on studying the latest analyst forecasts, we found that while the company has seen growth in its past earnings, analysts expect its future earnings to shrink. Are these analysts expectations based on the broad expectations for the industry, or on the company's fundamentals? Click here to be taken to our analyst's forecasts page for the company.
New: AI Stock Screener & Alerts
Our new AI Stock Screener scans the market every day to uncover opportunities.
• Dividend Powerhouses (3%+ Yield)
• Undervalued Small Caps with Insider Buying
• High growth Tech and AI Companies
Or build your own from over 50 metrics.
Have feedback on this article? Concerned about the content? Get in touch with us directly. Alternatively, email editorial-team (at) simplywallst.com.
This article by Simply Wall St is general in nature. We provide commentary based on historical data and analyst forecasts only using an unbiased methodology and our articles are not intended to be financial advice. It does not constitute a recommendation to buy or sell any stock, and does not take account of your objectives, or your financial situation. We aim to bring you long-term focused analysis driven by fundamental data. Note that our analysis may not factor in the latest price-sensitive company announcements or qualitative material. Simply Wall St has no position in any stocks mentioned.
About TSX:FTG
Firan Technology Group
Manufactures and sells aerospace and defense electronic products and subsystems in Canada, the United States, Asia, Europe, and rest of Americas.
Undervalued with excellent balance sheet.
