NTG Clarity Networks Inc. (CVE:NCI) Stock Catapults 33% Though Its Price And Business Still Lag The Market
NTG Clarity Networks Inc. (CVE:NCI) shares have continued their recent momentum with a 33% gain in the last month alone. The last 30 days bring the annual gain to a very sharp 71%.
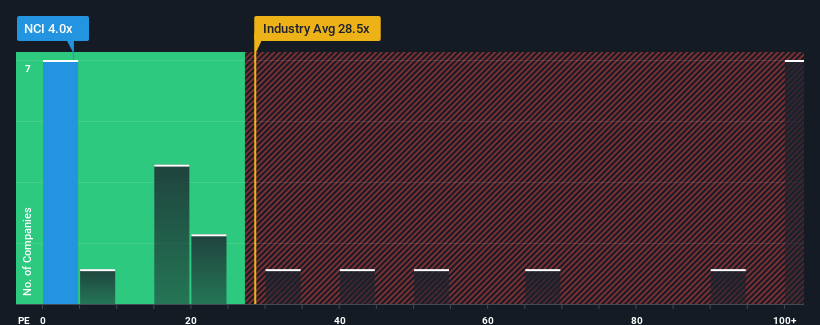
Although its price has surged higher, NTG Clarity Networks may still be sending very bullish signals at the moment with its price-to-earnings (or "P/E") ratio of 4x, since almost half of all companies in Canada have P/E ratios greater than 14x and even P/E's higher than 28x are not unusual. Although, it's not wise to just take the P/E at face value as there may be an explanation why it's so limited.
With earnings growth that's exceedingly strong of late, NTG Clarity Networks has been doing very well. One possibility is that the P/E is low because investors think this strong earnings growth might actually underperform the broader market in the near future. If that doesn't eventuate, then existing shareholders have reason to be quite optimistic about the future direction of the share price.
Check out our latest analysis for NTG Clarity Networks

Does Growth Match The Low P/E?
The only time you'd be truly comfortable seeing a P/E as depressed as NTG Clarity Networks' is when the company's growth is on track to lag the market decidedly.
If we review the last year of earnings growth, the company posted a terrific increase of 109%. However, the latest three year period hasn't been as great in aggregate as it didn't manage to provide any growth at all. So it appears to us that the company has had a mixed result in terms of growing earnings over that time.
Weighing that recent medium-term earnings trajectory against the broader market's one-year forecast for expansion of 23% shows it's noticeably less attractive on an annualised basis.
With this information, we can see why NTG Clarity Networks is trading at a P/E lower than the market. Apparently many shareholders weren't comfortable holding on to something they believe will continue to trail the bourse.
The Final Word
NTG Clarity Networks' recent share price jump still sees its P/E sitting firmly flat on the ground. Typically, we'd caution against reading too much into price-to-earnings ratios when settling on investment decisions, though it can reveal plenty about what other market participants think about the company.
As we suspected, our examination of NTG Clarity Networks revealed its three-year earnings trends are contributing to its low P/E, given they look worse than current market expectations. Right now shareholders are accepting the low P/E as they concede future earnings probably won't provide any pleasant surprises. Unless the recent medium-term conditions improve, they will continue to form a barrier for the share price around these levels.
There are also other vital risk factors to consider and we've discovered 6 warning signs for NTG Clarity Networks (3 can't be ignored!) that you should be aware of before investing here.
If P/E ratios interest you, you may wish to see this free collection of other companies with strong earnings growth and low P/E ratios.
Valuation is complex, but we're here to simplify it.
Discover if NTG Clarity Networks might be undervalued or overvalued with our detailed analysis, featuring fair value estimates, potential risks, dividends, insider trades, and its financial condition.
Access Free AnalysisHave feedback on this article? Concerned about the content? Get in touch with us directly. Alternatively, email editorial-team (at) simplywallst.com.
This article by Simply Wall St is general in nature. We provide commentary based on historical data and analyst forecasts only using an unbiased methodology and our articles are not intended to be financial advice. It does not constitute a recommendation to buy or sell any stock, and does not take account of your objectives, or your financial situation. We aim to bring you long-term focused analysis driven by fundamental data. Note that our analysis may not factor in the latest price-sensitive company announcements or qualitative material. Simply Wall St has no position in any stocks mentioned.
About TSXV:NCI
NTG Clarity Networks
Provides network, telecom, IT, and infrastructure solutions to medium and large network service providers in Canada, North America, Iraq, Saudi Arabia, Egypt, and Oman.
Undervalued with excellent balance sheet.
Similar Companies
Market Insights
Community Narratives


Recently Updated Narratives

Astor Enerji will surge with a fair value of $140.43 in the next 3 years

Proximus: The State-Backed Backup Plan with 7% Gross Yield and 15% Currency Upside.


A case for for IMPACT Silver Corp (TSXV:IPT) to reach USD $4.52 (CAD $6.16) in 2026 (23 bagger in 1 year) and USD $5.76 (CAD $7.89) by 2030
Popular Narratives


MicroVision will explode future revenue by 380.37% with a vision towards success


The company that turned a verb into a global necessity and basically runs the modern internet, digital ads, smartphones, maps, and AI.


